
What
Americans
Think about
America
First
RESULTS OF THE 2017 CHICAGO
COUNCIL SURVEY OF AMERICAN PUBLIC
OPINION AND US FOREIGN POLICY
By
Dina Smeltz
Ivo Daalder
Karl Friedho
Craig Kafura

2017 Chicago Council
Survey Team
Joshua Busby
Associate Professor of Public
Aairs, The University of Texas
Karl Friedho
Fellow, Public Opinion and
Foreign Policy, Chicago Council
on Global Aairs
Gregory Holyk
Senior Research Analyst,
Langer Research
Grace Kim
Intern, Chicago Council on
Global Aairs
Craig Kafura
Research Associate, Chicago
Council on Global Aairs
Dina Smeltz
Senior Fellow, Public Opinion
and Foreign Policy, Chicago
Council on Global Aairs
Karen Whisler
Intern, Chicago Council on
Global Aairs
Lily Wojtowicz
Research Associate, Chicago
Council on Global Aairs
Foreign Policy Advisory Board
Ivo Daalder
President, Chicago Council on
Global Aairs
Michael Desch
Professor, Department
of Political Science, University
of Notre Dame
Daniel Drezner
Professor of International Politics,
Fletcher School of Law and
Diplomacy, Tufts University
Peter Feaver
Professor of Political Science
and Public Policy, Duke University
Bruce Jentleson
Professor of Political Science
and Public Policy, Duke University
Ellen Laipson
Distinguished Fellow and
President Emeritus, Stimson
Center
Tod Lindberg
Senior Fellow, Hudson Institute
James Lindsay
Senior Vice President, Director
of Studies, Council on Foreign
Relations
Diana Mutz
Samuel A. Stouer Professor
of Political Science and
Communication, University of
Pennsylvania
Kori Schake
Distinguished Research Fellow,
Hoover Institution
James Steinberg
University Professor, Maxwell
School of Citizenship and Public
Aairs, Syracuse University
The Chicago Council on Global
Aairs is an independent,
nonpartisan organization.
All statements of fact and
expressions of opinion contained
in this report are the sole
responsibility of the authors and
do not necessarily reflect the
views of the Chicago Council on
Global Aairs or of the project
funders.
Copyright © 2017 by the Chicago
Council on Global Aairs.
All rights reserved.
Printed in the United States of
America.
This report may not be
reproduced in whole or in
part, in any form (beyond that
copying permitted by sections
107 and 108 of the US Copyright
Law and excerpts by reviewers
for the public press), without
written permission from the
publisher. For further information
about the Chicago Council or
this study, please write to the
Chicago Council on Global Aairs,
Prudential Plaza, 180 North
Stetson Avenue, Suite 1400,
Chicago, Illinois 60601, or visit
thechicagocouncil.org.

1
TABLE OF CONTENTS
EXECUTIVE
SUMMARY
2
INTRODUCTION
8
AMERICANS AND
ALLIANCES
10
AMERICANS AND
TRADE
18
AMERICANS ON
IMMIGRATION AND
CLIMATE CHANGE
25
CONCLUSION
30
APPENDIX
31
METHODOLOGY
36
ABOUT THE
SURVEY SAMPLE
39
ABOUT THE
CHICAGO COUNCIL
SURVEY
41
ENDNOTES
42

2
What Americans Think about America First 2017 Chicago Council Survey
EXECUTIVE SUMMARY
President Trump’s inaugural address, like his campaign, signaled a major departure from the past seven
decades of American foreign policy and engagement with the rest of the world. While never fully parsed,
the slogans “Make America Great Again,” “America First,” and “Americanism, not Globalism,” along with
the president’s speeches and tweets, prescribed greater protectionism in trade, a new financial reckoning
with our security allies, and a withdrawal from major international agreements.
The 2017 Chicago Council Survey, conducted roughly six months into the Trump administration, tested
the appeal of these ideas among the American public. The results suggest their attraction remains limited.
For now, public criticism of trade deals, support for withholding US security guarantees from allies, and
calls for restricting immigration mainly appeal to a core group of Trump supporters (defined in this report
as those Americans with a very favorable view of President Trump). Yet, aside from the president’s core
supporters, most Americans prefer the type of foreign policy that has been typical of US administrations,
be they Republican or Democrat, since World War II.
“FROM THIS DAY FORWARD, IT’S GOING TO BE ONLY AMERICA FIRST.
AMERICA FIRST. EVERY DECISION ON TRADE, ON TAXES, ON IMMIGRATION,
ON FOREIGN AFFAIRS, WILL BE MADE TO BENEFIT AMERICAN WORKERS
AND AMERICAN FAMILIES.”
—PRESIDENT DONALD TRUMP, INAUGURAL SPEECH, JANUARY 20, 2017
“CORE TRUMP SUPPORTERS” ARE THOSE IN THE SAMPLE WHO SAY THEY
HAVE A “VERY FAVORABLE” VIEW OF US PRESIDENT DONALD TRUMP. THIS
GROUP CONSTITUTES 21 PERCENT OF THE OVERALL SAMPLE; 62 PERCENT
SELF-IDENTIFY AS REPUBLICANS, 31 PERCENT AS INDEPENDENTS, AND
5 PERCENT AS DEMOCRATS.
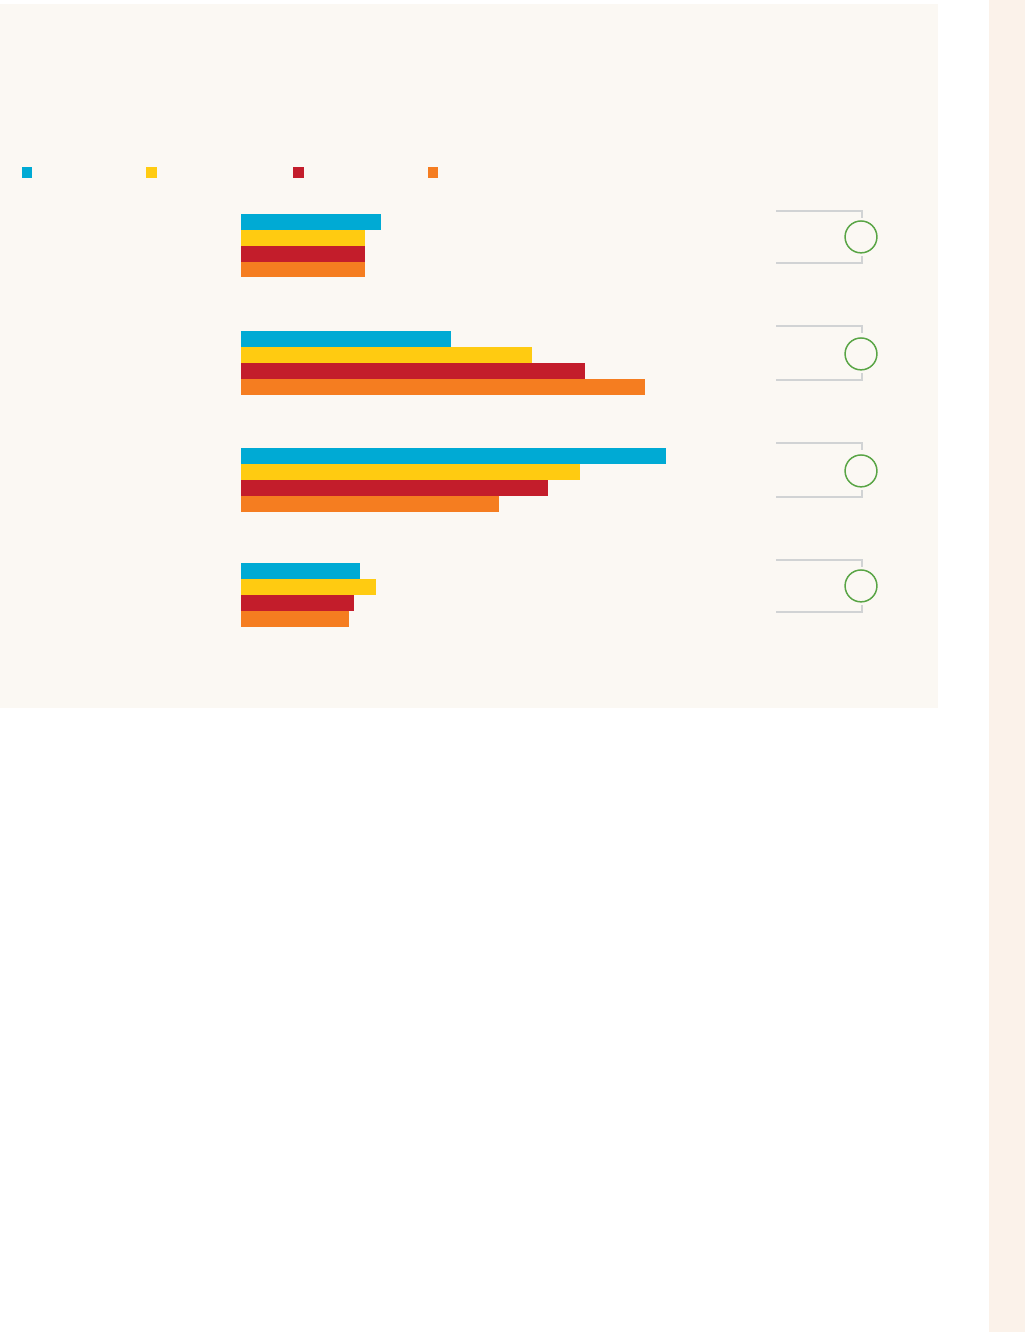
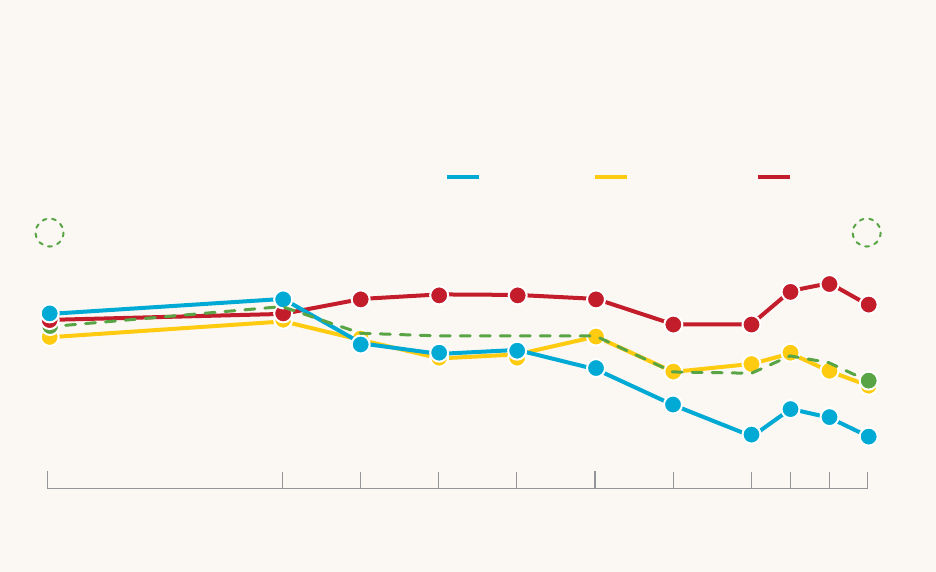
Majorities continue to endorse sustaining American engagement abroad (Figure A) as well as maintaining
alliances, supporting trade, and participating in international agreements. Indeed, in key instances,
Americans have doubled down on these beliefs. Public support has risen to new highs when it comes to
willingness to defend allies, the perceived benefits of trade, and a desire to grant undocumented
workers a path to citizenship.
Americans Value Allies and Are More Willing Than Ever
to Defend Them
During the 2016 campaign and into his presidency, Donald Trump has repeatedly criticized allies of free-
riding on America’s security guarantee and argued that US alliances were not serving American interests.
3
Executive Summary
63
RepublicansIndependentsDemocrats
72
65
68
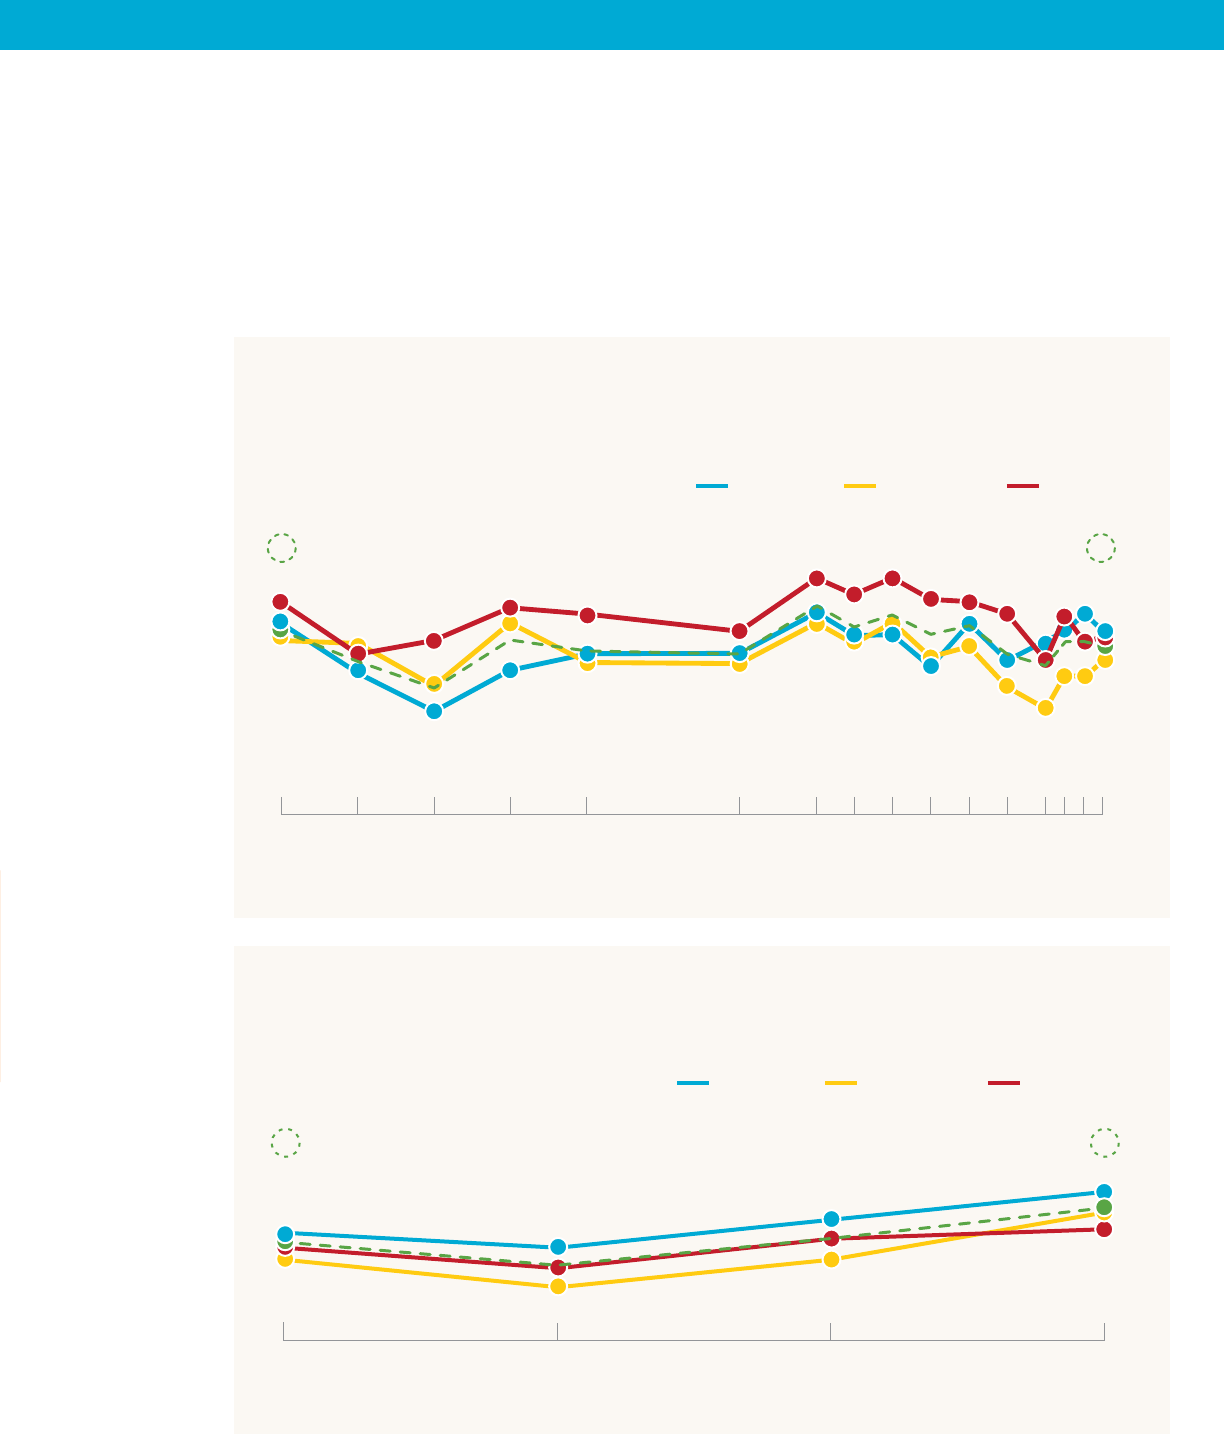
Figure A: US Role in World Aairs
Do you think it will be best for the future of the country if we take an active part in world aairs or if
we stay out of world aairs? (% active part)
n = 2,020
61
66
63
58
55
49
64
59
69
60
61
69
70
77
74
77
64
68
65
60
59
73
68
72
55
70
51
64
1974
1978
1982
1986
1990
1998
2002
2004
2006
2008
2010
2012
2014
2015
2016
2017
68
58
71
2017 Chicago Council Survey
61
60
57
69
57
70
60
64
60
66
65
65
Overall
66
Overall
63
67
But the US public disagrees. Americans have repeatedly rated alliances as one of the most eective
ways for the United States to achieve its foreign policy goals since the question was first asked in 2014.
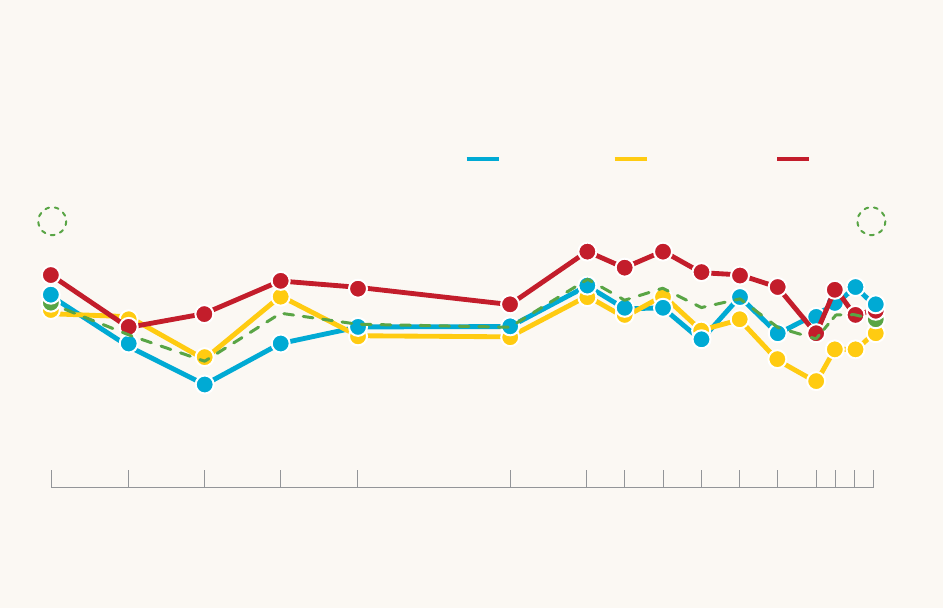
Today, the US public is more convinced than ever of their importance. Americans rate maintaining existing
alliances as the most eective foreign policy tool, with 49 percent responding “very eective” (Figure B),
followed by maintaining US military superiority (47%) and building new alliances with other countries (36%).
RepublicansIndependentsDemocrats
37
34
41
Figure B: Maintaining Existing Alliances
How eective do you think each of the following approaches is to achieving the foreign policy goals of the
United States: Maintaining existing alliances (% very eective)
n = 2,020
26
37
31
34
45
40
47
55
43
2014 2015 2016 2017
2017 Chicago Council Survey
Overall
38
Overall
49

4
What Americans Think about America First 2017 Chicago Council Survey
Americans also express confidence in Asian and European allies to deal responsibly with world problems,
and solid majorities favor maintaining or increasing the US military presence in the Asia-Pacific (78%),
Europe (73%), and the Middle East (70%). A slightly larger majority now (69%) compared with a year ago
(65%) say NATO is essential to US security. And for the first time, majorities of Americans are willing to use
US troops to defend South Korea if it is invaded by North Korea (62%) or if NATO allies like Latvia,
Lithuania, or Estonia are invaded by Russia (52%).
The most specific wish that President Trump has for NATO is for allied countries to contribute more to
collective defense; he and other administration ocials have advocated for withholding US commitment
to defend allies until they have paid more. But a majority of Americans think that NATO allies should
be convinced to do their part through persuasion and diplomatic channels (59%) rather than threatening
to withhold the US security guarantee to NATO allies to get them to pay more for defense (38%).
Given these views, it is clear that Americans appreciate the advantages that alliances bring. Majorities say
that alliances with Europe and East Asia (60% each) are either mutually beneficial or mostly benefit the
United States, and 48 percent say the same about alliances in the Middle East.
Core Trump supporters are the most skeptical of the benefits regarding alliances for the United States.
Perhaps taking their lead from the president, a majority favor withholding US security guarantee
from NATO allies until they pay more (60%); 51 percent of overall Republicans agree. But even core Trump
supporters do not seem to believe the alliance is “obsolete,” given that a majority (54%) think NATO
is still essential to US security.
A Record Percentage of Americans Recognize Benefits of Trade
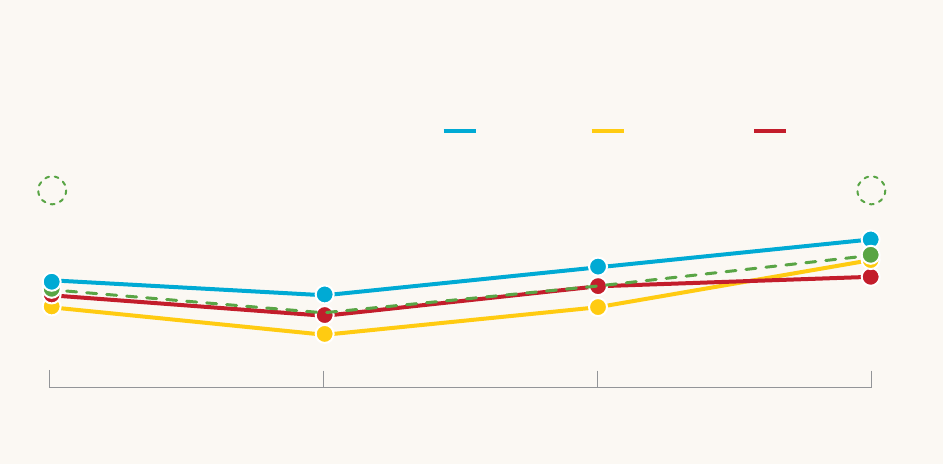
Americans are feeling more optimistic about the positive impact of trade. Compared with a year ago,
record numbers of Americans now say that international trade is good for US consumers (78%), for
the US economy (72%), and for job creation (57%). (See Figure C.) Additionally, the perceived benefits of
trade are up across all party aliations.
Creating jobs in the
United States
Consumers like youThe US economy
73
38
57
Figure C: International Trade
Overall, do you think international trade is good or bad for: (% good)
n = 2,020
37
54
70
40
59
70
57
72
2004 2006 2016 2017
2017 Chicago Council Survey
78

5
Executive Summary
A majority of Americans believe that trade deals between the United States and other countries benefit
both countries (50%) or mostly benefit the United States (7%). But a substantial percentage of Americans—
including a majority of core Trump supporters and a plurality of Republicans overall—think other countries
mostly benefit (34%) or neither country benefits (6%).
President Trump has blamed poor trade deals for the loss of American jobs, and on this point, Americans
agree. A majority say that manufacturing job losses are due to outsourcing (56%) rather than increased
automation (42%). Yet, more Americans say that the current administration’s policies will harm (41%) rather
than help (32%) US workers, and 24 percent say they will make no dierence.
There are clear partisan divides on expectations for the new administration. Solid majorities of core
Trump supporters (82%) and Republicans (64%) expect this administration’s policies will do more to protect
US workers, which may help explain why they are more optimistic about the overall benefits of interna-
tional trade to the US economy, consumers, and job creation. For their part, Democrats may feel the need
to underscore their support for international trade as a reaction against the trade-bashing rhetoric from
both Republican and Democratic candidates in 2016.
Concern over Immigration at Lowest Point Yet
Immigration was a central issue during the 2016 presidential campaign, and it remains a key pillar in
Donald Trump’s America First platform. But the American public is less alarmed than last year by the
potential threat of large numbers of immigrants and refugees entering the United States. Just 37 percent
of Americans characterize immigration as a critical threat, down from 43 percent in 2016, marking a new
low in concern for this issue (Figure D). There are, however, still large dierences between Democrats (20%)
and Republicans (61%), with core Trump supporters the most likely of all to consider immigration a critical
threat (80%).
Republicans
Independents
Democrats
56
51
58
Figure D: Immigration as a Threat
Below is a list of possible threats to the vital interest of the United States in the next 10 years. For each
one, please select whether you see this as a critical threat, an important but not critical threat, or not an
important threat at all: Large numbers of immigrants and refugees coming into the United States
(% critical threat)
n = 2,020
58
63
57
62
50
49
62
44
46 47
63
44
51
41
62
55
40
30
42
21
55
46
29
27
64
36
40
20
61
67
1998 2002 2004 2006 2008 2010 2012 2014 2015 2016 2017
2017 Chicago Council Survey
Overall
55
Overall
37

6
What Americans Think about America First 2017 Chicago Council Survey
As the overall perceived threat from immigration has gone down, support for providing an opportunity
for illegal workers in the United States to become citizens has gone up. Among all Americans, two-thirds
(65%) support providing illegal immigrants a path to citizenship either immediately or with a waiting
period and a financial penalty—an increase of 7 percentage points since last year. Conversely, fewer
Americans now say that illegal immigrants should be required to leave their jobs and the United States
(22%, down from 28% in 2016).
A clear majority of Democrats (77%, up from 71% in 2016) favor a pathway to citizenship either immediately
or with conditions. A smaller majority of Republicans now also favor the same solution as Democrats
(52%, up from 44%), although 36 percent of Republicans favor deportation (down from 42% in 2016). Even
core Trump supporters are divided in their views, with equal numbers supporting deportation (45%) and
a path to citizenship (45%) for illegal immigrants.
Majority Continue to Support Paris Agreement
Conducted just weeks after President Trump kept his campaign promise to withdraw from the Paris
Agreement on climate change, the 2017 Chicago Council Survey reveals that 6 in 10 Americans (62%) con-
tinue to favor US participation in the agreement. However, overall public support of the Paris Agreement
has declined since 2016 (when 71% favored participation) largely because of a 20-point drop in Republican
support (37%, down from 57% in 2016), perhaps following the president’s lead on this issue. Just 24 percent
of core Trump supporters want the United States to participate in the agreement. In contrast, majorities of
Democrats (83%) and Independents (60%) continue to support the Paris Accord, though also at slightly lower
levels than in 2016 (when it was backed by 87% of Democrats and 68% of Independents).
Overall, 46 percent of Americans say that climate change is now a critical threat facing the United States;
while still not a majority, this view reflects the highest point of concern recorded by the Chicago Council
Survey. Yet, Republicans and Democrats markedly disagree on the gravity of this issue. Seven in 10
Democrats think that climate change is a critical threat, compared with just 16 percent of Republicans and
12 percent of core Trump supporters (Figure E).
Republicans
Independents
Democrats
19
40
58
Figure E: Climate Change as a Threat
Below is a list of possible threats to the vital interest of the United States in the next 10 years. For each
one, please select whether you see this as a critical threat, an important but not critical threat, or not an
important threat at all: Climate change (% critical threat)
n = 2,020
2008 2010 2012 2014 2015 2016 2017
2017 Chicago Council Survey
16
35
50
16
15
33
44
12
17
18
51
58
57
69
35
35
38
46
Overall
39
Overall
46

7
Fractures within the Republican Party Base
Headlines over the past year have proclaimed an internal battle within the Republican Party between
President Trump’s supporters and those who oppose his policies.
1
The 2017 Chicago Council Survey
data illustrate these fissures between self-described Republicans who have a very favorable view of
President Trump (“Trump Republicans”) and those who do not (“non-Trump Republicans”).
2
Non-Trump Republicans align more with average US public opinion than they do with Trump Republicans.
Non-Trump Republicans are closer to the overall public than to Trump Republicans in their views on NAFTA
(53% overall public, 49% non-Trump Republicans, 20% Trump Republicans believe the agreement is good
for the US economy). Non-Trump Republicans are also closer to the overall public when asked the best
way to get US allies to pay more for their defense (61% Trump Republicans, 40% non-Trump Republicans,
and 38% overall favor withholding the US security guarantee). And on immigration, the overall public
(65%) and non-Trump Republicans (62%) are more aligned in supporting a path to citizenship for illegal
immigrants than Trump Republicans (43%). Specific examples of other dierences among Republicans
are included in each chapter of this report (see the sidebars on pages 16, 23, and 29).
Conclusion
Despite the politically charged environment over the past year, Americans express remarkably enduring
support for an active US role in world aairs, for security alliances, and for trade relationships. They
also favor oering illegal immigrants an opportunity to earn citizenship, either immediately or with
conditions—a fact often overlooked by political leaders. Even though a portion of Americans have some
questions about how much the United States gets out of security alliances and trade agreements, the
American public as a whole seems to recognize clear value in maintaining them.
President Trump appears to have noticed, and he has begun to adjust some of his campaign positions
since moving into the Oval Oce. He has declared that NATO is no longer obsolete and has taken some
steps to reassure allies that the United States will honor its defense commitments. Ocials in Trump’s
administration, including the vice president and the secretaries of state and defense, hold more main-
stream views on defense issues, and they have repeatedly traveled to allied nations to smooth rued
feathers. President Trump has also moderated some of his anti-trade rhetoric, backing away from
accusations of Chinese currency manipulation and seeking to renegotiate rather than abandon NAFTA.
These moderated positions are closer to mainstream American views; they are also closer to the views
of those Republicans who are not core supporters of Donald Trump.
Executive Summary
REPUBLICANS REPRESENT 26 PERCENT OF THE OVERALL SAMPLE, AND
THEY ARE DIVIDED BETWEEN TRUMP REPUBLICANS (14% OF OVERALL
SAMPLE) AND NON-TRUMP REPUBLICANS (12%). TRUMP REPUBLICANS ARE
THOSE WHO SAY THEY HAVE A “VERY FAVORABLE” VIEW OF PRESIDENT
TRUMP; NON-TRUMP REPUBLICANS ARE THOSE WHO HAVE A “SOMEWHAT
FAVORABLE,” “SOMEWHAT UNFAVORABLE,” OR “VERY UNFAVORABLE”
VIEW OF PRESIDENT TRUMP.
8
What Americans Think about America First 2017 Chicago Council Survey
INTRODUCTION
To many observers, the “America First” plank in Donald Trump’s campaign described a policy vision that
would overturn decades of bipartisan US foreign policy. President Trump outlined his vision for America
First in his inaugural address: “Every decision on trade, on taxes, on immigration, on foreign aairs, will be
made to benefit American workers and American families.” This position has been interpreted by some
as a return to isolationism that could radically reorient America’s foreign policy and by others as a rejection
of America’s traditional security alliances, long-standing commitment to trade, and major international
agreements.
Whatever the particular perspective, the American public does not embrace a retreat or withdrawal of
the United States from the world. A majority of the American public (63%) continue to support an active role
for the United States in world aairs (Figure 1).
While Donald Trump’s rallying cry is to “Make America Great Again,” a majority of Americans believe it
already is. Americans continue to say that the United States is the most influential country in the world;
the public rates its influence as an average of 8.3 on a scale from 0 to 10, with 10 being the greatest
63
RepublicansIndependentsDemocrats
72
65
68
Figure 1: US Role in World Aairs
Do you think it will be best for the future of the country if we take an active part in world aairs or if
we stay out of world aairs? (% active part)
n = 2,020
61
66
63
58
55
49
64
59
69
60
61
69
70
77
74
77
64
68
65
60
59
73
68
72
55
70
51
64
1974
1978
1982
1986
1990
1998
2002
2004
2006
2008
2010
2012
2014
2015
2016
2017
68
58
71
2017 Chicago Council Survey
61
60
57
69
57
70
60
64
60
66
65
65
Overall
66
Overall
63
67

9
Introduction
possible amount of influence. (See Appendix Figure 1 for full results.) Overall, a majority also say that
because of its unique character, the United States is the greatest country in the world (63%).
3
Core Trump
supporters are, in fact, the most likely to say the United States is the greatest country (91%).
When it comes to the best way to project American influence abroad, an overall majority of Americans
(61%) want the United States to play a shared leadership role, and majorities of Democrats (68%) and
Independents (62%) agree. Republicans are divided: while 49 percent of Republicans prefer a shared
leadership role, 47 percent want the United States to be the dominant world leader. And a majority
of core Trump supporters (53%) say the United States should play a dominant leadership role in the world
(Figure 2).
Figure 2: US Leadership Role in the World
2017 Chicago Council Survey
What kind of leadership role should the United States play in the world? Should it be the dominant
world leader, or should it play a shared leadership role, or should it not play any leadership role? (%)
n = 2,020
Overall
32
Republicans
Independents
Democrats
Core Trump supporters
Dominant world
leader
Overall
61
Play a shared
leadership role
Overall
7
Not play any
leadership role
26
28
47
53
68
62
49
42
5
10
4
4
In the president’s view—as stated in his inaugural address—the United States has “made other countries
rich while the wealth, strength, and confidence of our country has disappeared over the horizon.” While
President Trump’s core supporters agree with this view, the 2017 Chicago Council Survey data discussed
in the following pages demonstrate that a majority of Americans reject the idea that we should question
our security alliances, abandon trade agreements, or walk away from international agreements. Overall,
Americans remain committed to engaging the world along the lines pursued by past administrations,
Republican and Democrat alike.
10
What Americans Think about America First 2017 Chicago Council Survey
AMERICANS AND ALLIANCES
During the 2016 presidential campaign and into his presidency, Donald Trump repeatedly accused
allies of free-riding on America’s security guarantee and argued that US alliances were not serving
American interests. Standing alongside NATO leaders last May, Trump bluntly told the assembled heads
of state that they owed “massive amounts of money” to the United States and NATO.
4
But the 2017 Chicago Council Survey shows that the American public continues to support many
aspects of the traditional US alliance system in Europe and Asia, including US commitments to their
defense. Views are more mixed on alliances with Middle Eastern countries. Still, only the core supporters
of President Trump seem to share his views on alliances.
Eectiveness of Maintaining Alliances
When it comes to the most eective ways to achieve US foreign policy goals, maintaining existing alliances
tops the list, with 49 percent of the American public saying this approach is very eective. Americans
also believe maintaining US military superiority (47%) and building new alliances with other countries (36%)
are eective approaches (See Appendix Figure 2).
In fact, Americans are more convinced now than they were in previous surveys that alliances are very ef-
fective. Democrats and Independents are responsible for much of this increase. A majority of Democrats
(55%) now say that maintaining existing alliances is a very eective way to achieve US foreign policy goals,
up from 45 percent in 2016. Independents have also become more convinced, increasing from 34 percent
in 2016 to 47 percent in 2017. Meanwhile, Republicans have been relatively steady (Figure 3).
RepublicansIndependentsDemocrats
37
34
41
Figure 3: Maintaining Existing Alliances
How eective do you think each of the following approaches is to achieving the foreign policy goals of the
United States: Maintaining existing alliances (% very eective)
n = 2,020
26
37
31
34
45
40
47
55
43
2014 2015 2016 2017
2017 Chicago Council Survey
Overall
38
Overall
49

11
Americans and Alliances
Mixed Views of Alliances among Republicans
President Trump sees US alliances as one-sided financial transactions, with allies largely free-riding
on American commitments, draining US resources with no resulting benefit. But the US public is not buying
this argument. While President Trump has derided traditional alliances in Europe and East Asia, the
American public strongly supports these partnerships. And while the president has embraced several
alliances in the Middle East, even choosing Saudi Arabia as his first overseas visit, the public is more
divided on alliances in this region.
Combined, 6 in 10 Americans say that either both the United States and allies benefit from alliances in
Europe and East Asia or that the United States benefits more. Americans are less enthusiastic about US
alliances in the Middle East: while a plurality say both sides benefit (42%) or the United States mostly
benefits (7%), significant portions of the public believe that US alliances there mostly benefit allies (25%)
or that neither country benefits (23%). (See Figure 4.)
President Trump’s core supporters are the most pessimistic about the benefits of alliances across all three
regions. These attitudes fit well with the Trump narrative that NATO is too costly and unfair to the United
States.
5
Republicans (including some but not all core Trump supporters) tend to say that the benefits of
alliances are mutual—although 4 in 10 say they mostly benefit allies or neither country. Whether this doubt
about the benefits of alliances was created by Donald Trump or whether he merely picked up on an
existing sentiment is unclear.
To be sure, the complaint about allies getting a free ride is not new. In 2016, President Obama griped
to The Atlantic about how “free riders aggravate[d]” him;
6
in 2011, Secretary of Defense Robert Gates
voiced concern about future political leaders who had not lived through the Cold War, saying they “may
not consider the return on America’s investment in NATO worth the cost” without increased allied spend-
ing;
7
and Secretary Madeleine Albright made sure to insist on fair burden sharing in her 1997 speech to
Congress advocating for NATO expansion.
8
Indeed, complaints about burden sharing are as old as the
NATO alliance itself.
THE 2017 CHICAGO COUNCIL SURVEY SHOWS THAT THE AMERICAN PUBLIC
CONTINUES TO SUPPORT MANY ASPECTS OF THE TRADITIONAL US
ALLIANCE SYSTEM IN EUROPE AND ASIA, INCLUDING US COMMITMENTS TO
THEIR DEFENSE.

12
What Americans Think about America First 2017 Chicago Council Survey
Mostly benefit
the United States
Mostly benefit
our allies
Benefit both the
United States and
our allies
Benefit neither
Mostly benefit
the United States
Mostly benefit
our allies
Benefit both the
United States and
our allies
Benefit neither
Figure 4: Who Benefits from US Security Alliances?
2017 Chicago Council Survey
Which of the following comes closest to your view on US security alliances in East Asia? (%) n = 694
RepublicansDemocrats Independents
Core Trump
supporters
Mostly benefit
the United States
Mostly benefit
our allies
5
11
10
2
32
Overall
8
Benefit both the
United States and
our allies
43
55
50
50
51
Benefit neither
12
17
19
10
16
19
14
17
31
4
10
8
5
42
62
47
50
45
8
53
7
11
11
7
10
27
15
33
35
6
6
8
6
38
45
37
44
33
7
42
18
24
29
13
23
25
22
22
34
Which of the following comes closest to your view on US security alliances in Europe? (%) n = 670
Which of the following comes closest to your view on US security alliances in the Middle East? (%) n = 656

13
Support for NATO
During the 2016 presidential campaign, NATO was a favorite target of criticism for Donald Trump, and
that targeting carried over to the early part of his administration. His distaste for NATO is not shared by
many other prominent Republicans; members of his own administration repeatedly sought to reassure
NATO allies that the US commitment to their defense remained inviolable. After the president visited
NATO headquarters and failed to explicitly endorse the collective defense provisions in Article 5, Senator
Lindsay Graham proposed a resolution that aimed to “reassure our allies and give notice to our enemies
that America stands firmly in support of NATO and our Article 5 commitment.”
9
The resolution passed
unanimously in the Senate. Eventually, President Trump himself indicated his support for Article 5 and
stated that NATO is “no longer obsolete.”
10
Throughout this debate, the American public has been consistently supportive of NATO. In the 2017
Chicago Council Survey, 69 percent of Americans say NATO is still essential to US security, up slightly
from 2016 (65%) and up significantly from 2002 (56%), when the question was first asked. Public support
is also bipartisan, with majorities of Democrats (82%), Independents (64%), and Republicans (60%)
describing NATO as essential, views largely unchanged from 2016. Even a majority of core Trump
supporters (54%) agree that NATO is still essential to US security (Figure 5).
Figure 5: Commitment to NATO
2017 Chicago Council Survey
Some people say that NATO is still essential to our country's security. Others say it is no longer
essential. Which of these views is closer to your own? (%)
n = 2,020
Overall
69
Republicans
Independents
Democrats
Core Trump supporters
Still essential
Overall
27
No longer essential
82
64
60
54
16
33
36
43
The biggest complaint Trump has about NATO is that the allies do not spend enough on defense. President
Trump threatened that he would withhold US contributions—or even withdraw from NATO—if other
NATO countries did not meet their commitments.
11
Even Defense Secretary Mattis suggested the United
States could reduce its commitments if NATO countries did not spend more on defense.
12
The overall
US public thinks that to encourage NATO allies to actually follow through on defense-spending increases,
the United States should use persuasion and diplomacy (59%) rather than withholding its security
commitment to NATO allies (38%).
Americans and Alliances

14
What Americans Think about America First 2017 Chicago Council Survey
But there is a clear partisan divide on the best way to pressure allies on their spending commitments.
Democrats (72%) and Independents (56%) think the United States should use persuasion and diplomacy.
By a slim margin, Republicans prefer withholding the US security guarantee (51%) to using persuasion
and diplomacy (46%). An even greater percentage of core Trump supporters (60%) says the United States
should withhold the security commitment until allies actually increase defense spending (Figure 6).
Figure 6: Options if NATO Allies Don't Spend More on Defense
2017 Chicago Council Survey
As you may know, the United States has long urged its NATO allies to spend more on defense. They
have recently agreed to increase defense spending but have not yet done so. Which of the following
options comes closer to your view? (%)
n = 2,020
Overall
59
Republicans
Independents
Democrats
Core Trump supporters
The United States should
encourage greater allied
defense spending through
persuasion and diplomatic
means while maintaining
a firm commitment to defend
NATO members
Overall
38
The United States should
withhold its commitment to
defend NATO members until
NATO allies actually spend
more on defense
72
56
46
38
25
42
51
60
Americans Trust Allies and Support a Global Military Footprint
America’s global alliances often include maintaining US military bases overseas, and the 2017 Survey
finds broad support for a continued US military presence abroad. Americans support increasing or
maintaining the US military presence in the Asia-Pacific (78%), Europe (73%), and the Middle East (70%).
(See Appendix Figure 3 for full results.)
Senior Trump administration ocials have argued that “America First does not mean America Alone.”
13
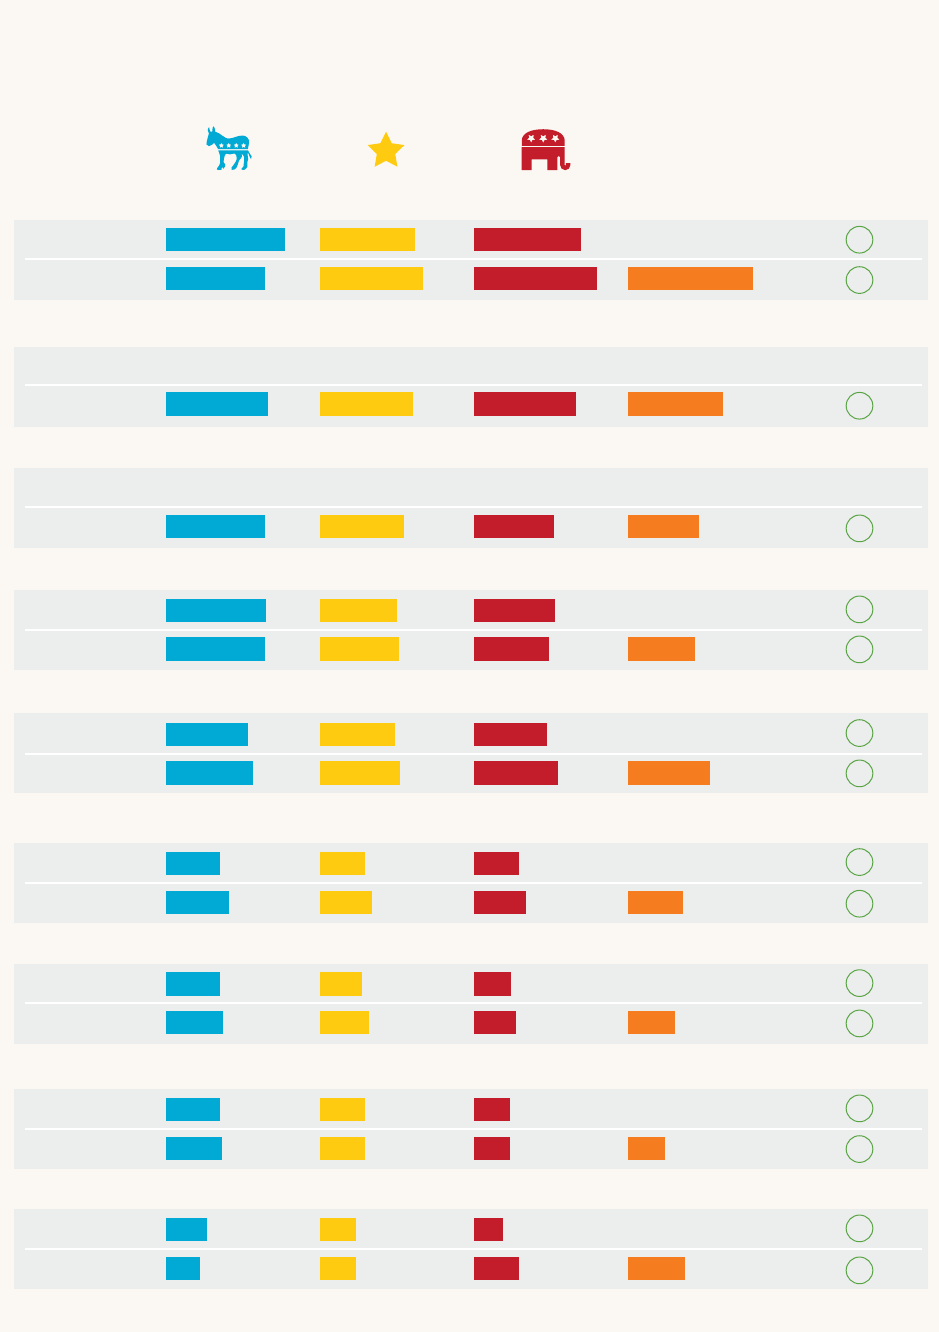
On this particular statement, Americans agree. The public trusts allied nations around the globe, along
with the United States, to handle world problems responsibly. Across party lines, and even among core
Trump supporters, majorities have a great deal or a fair amount of confidence in the European Union,
Germany, Japan, and the United Kingdom to deal responsibly with world problems. In fact, trust is on the
rise: for both Japan and South Korea, more Americans now trust them to handle world problems than
in 2015 when the question was last asked (Figure 7).
15
Figure 7: Confidence in Other Countries
2017 Chicago Council Survey
91 73 82
76 79 94 96
How much confidence would you say you have in the following countries to deal responsibly
with world problems? (% a great deal/fair amount)
n = 2,020
United States
2015
2017
82
N/A
81
RepublicansDemocrats Independents
Core Trump
supporters Overall
41 32 28
44 37 32 36
China
2015
2017
34
N/A
38
31 27 22
26 27 34 44
Russia
2015
2017
27
N/A
28
63 57 56
67 61 64 63
Japan
2015
2017
58
N/A
64
41 34 34
48 40 40 42
South Korea
2015
2017
36
N/A
42
77 59 62
76 60 57 51
European Union
2015
2017
66
N/A
65
41 34 27
43 34 27 28
India
2015
2017
34
N/A
36
76 64 61 54
Germany
2015
2017
N/AN/AN/AN/AN/A
67
78 71 78 73
United Kingdom
2015
2017
N/AN/AN/AN/AN/A
75
Americans and Alliances

16
What Americans Think about America First 2017 Chicago Council Survey
Public Ready to Come to Defense of NATO Allies, South Korea
At the core of a military alliance is the obligation to come to an ally’s defense if it is attacked. For the first
time in Chicago Council Survey history, a majority of the US public are willing to commit US troops to
defend South Korea and the Baltic NATO allies if they come under attack.
14
A majority of Americans (52%)
support the use of US troops if Russia invades a NATO ally like Latvia, Lithuania, or Estonia, up from 45
percent in 2015. Six in 10 Americans (62%) also support defending South Korea from North Korean invasion,
up from 47 percent in 2015. In both scenarios, cross-partisan majorities of Democrats, Independents, and
Republicans—and a majority of core Trump supporters—favor using US troops to defend these allied
nations. (See Appendix Figure 4 for full results.)
While Americans clearly value their ties to Japan, they remain more hesitant about intervening in a
hypothetical confrontation between Japan and China.
15
Although they are more likely now (40%) than they
were in 2015 (33%) to support using US troops in a confrontation between Japan and China over disputed
islands, a majority still oppose US military involvement (58%). Americans are also hesitant to get involved
in a war against Russia on behalf of Ukraine, which is not a NATO member (59% oppose, 39% favor).
Many Trump and non-Trump Republicans see mutual
benefits or more benefits for the United States from
alliances in East Asia, Europe, and the Middle East.
But there are clear dierences in how these two
groups want to interact with those allies. A majority
of Trump Republicans (61%) favor withholding
NOT ALL REPUBLICANS THINK ALIKE ON ALLIANCES
Figure: NATO
2017 Chicago Council Survey
As you may know, the United States has long urged its NATO allies to spend more on defense. They
have recently agreed to increase defense spending but have not yet done so. Which of the following
options comes closer to your view? (%)
n = 725
Overall
38
Non-Trump Republicans
Trump Republicans
Core Trump supporters
The United States should
withhold its commitment to
defend NATO members until
NATO allies actually spend
more on defense
Overall
59
The United States should
encourage greater allied defense
spending through persuasion
and diplomatic means while
maintaining a firm commitment
to defend NATO members
60
61
40
38
37
58
America’s NATO commitment until its allies spend
more on defense, although 55 percent believe
that NATO is still essential. Non-Trump Republicans,
like the overall US public, are more consistently
pro-NATO. They support using persuasion and
diplomacy to get allies to pay more for defense, and
two in three say NATO is essential to US security.
SIDEBAR

17
Making Existing Alliances Work
Underpinning this broad support for alliances is a view that the United States derives clear advantages
from them. Analysis of the 2017 Chicago Council Survey data shows that even the minority of Americans
who think that US security alliances mostly benefit our allies or neither country still support American
military partnerships. They favor maintaining or increasing the US military presence abroad, express
confidence in key allies, and believe that NATO is essential to US security. In short, Americans are more
interested in making the existing relationships work than filing for divorce.
Americans and Alliances

18
What Americans Think about America First 2017 Chicago Council Survey
AMERICANS AND TRADE
Donald Trump placed American workers at the center of his domestic and foreign policy platforms. As
a candidate and as president, he has criticized trade agreements for benefiting other countries at the
direct expense of the US economy and American workers. The 2017 Survey finds that this message has
clearly resonated with his base and with a portion of the broader public. But in general, Americans
have begun to see the eects of trade on the overall US economy, consumers, and job creation more
positively. Republicans are now more optimistic about the impact of trade, potentially because a
Republican who promises to deliver better trade deals is now in the White House. At the same time,
Democrats continue to express favorable attitudes toward trade, in some instances at even higher levels
of support than in previous years—perhaps as a forceful rejection of the anti-trade message from a
president they deeply dislike.
Positive Assessments of Trade Benefits Have Increased
across Party Lines
In a speech before signing the “Buy American and Hire American” executive order on trade, Trump said
that “jobs and wealth have been stripped from our country. Year after year, decade after decade, trade
deficit upon trade deficit . . . and lots of jobs.”
16
Despite this rhetoric, American perceptions of the benefits
of international trade are more positive now than they were a year ago. In fact, record numbers of
Americans now say international trade is good for US consumers (78%) and the US economy (72%).
Moreover, the 2017 results mark the first time since this question was asked that a majority of respondents
claim international trade is beneficial to creating US jobs (57%). (See Figure 8.)
Creating jobs in the
United States
Consumers like youThe US economy
73
38
57
Figure 8: International Trade
Overall, do you think international trade is good or bad for: (% good)
n = 2,020
37
54
70
40
59
70
57
72
2004 2006 2016 2017
2017 Chicago Council Survey
78

19
Americans and Trade
Previous surveys suggest that Democratic and Republican views on the eects of international trade on
the US economy and consumers change based on the party occupying the White House. In 2004 and
2006—during the George W. Bush administration—Republicans were more likely than Democrats to
say that international trade was good for the US economy. In the latter survey, Republicans were also
more likely to say that trade is beneficial to consumers. In 2016, with Barack Obama in the White
House, Democrats were more positive about international trade’s impact on the US economy, American
consumers, and job creation.
The 2017 Chicago Council Survey results go against the grain of that pattern, finding that, even
with a Republican now president, Democrats remain the most likely to see the benefits of international
trade for US consumers (83%), the US economy (80%), and creating jobs in the United States (69%).
Democrats also remain the most favorable toward globalization, with 77 percent saying it is good for the
United States, up from 55 percent when the question was first asked in 1998.
Still, favorable Republican attitudes on international trade have increased with a GOP White House. In
2017, a greater percentage of Republicans say that trade is good for consumers (77%), the US economy
(68%), and job creation (48%) than ever before. Core Trump supporters are similar to Republicans in citing
the benefits to consumers (69%), the US economy (62%), and job creation (48%).
17
But Republican views have not become more favorable toward globalization over the years, with 55 per-
cent saying globalization is good in 2017—essentially unchanged from the 57 percent who said the
same in 1998 (Figure 9). The following sections will also demonstrate that Republicans overall are not
nearly as positive about existing trade agreements.
Republicans
Independents
Democrats
57
52
55
Figure 9: Globalization
Do you believe that globalization, especially the increasing connections of our economy with others around
the world, is mostly good or mostly bad for the United States? (% mostly good)
n = 2,020
1998 2002 2004 2006 2008 2010 2012 2014 2016 2017
2017 Chicago Council Survey
55
59
77
Overall
53
Overall
64

20
What Americans Think about America First 2017 Chicago Council Survey
It’s All about the Jobs
Jobs, as always, are at the heart of American concerns and priorities. Since the Council’s first survey in 1974,
Americans have consistently prioritized the protection of American jobs as one of the most important
foreign policy goals, and that remains true in 2017. Three-quarters of Americans (73%) name it a very
important goal, the same as in 2016. This assessment crosses partisan lines, with at least 7 in 10 respon-
dents in agreement, and is the number-one priority of core Trump supporters (87%).
Donald Trump has attracted much support from his base due to his attention to the American working
class. From 2000 to 2010, the United States lost more than 5 million manufacturing jobs. President
Trump (and other presidential candidates) often linked the loss of these jobs to international trade and
outsourcing. In contrast, economic experts attribute the loss of US manufacturing jobs to increased
automation more than to outsourcing.
18
Regardless, the American public broadly agrees with the president on this point. Nearly 6 in 10 say that
international trade and moving jobs overseas is responsible for the decline in American manufacturing
jobs, while only 4 in 10 blame automation. This view is particularly strong among core Trump supporters
(74%) and Republicans (68%). A bare majority of Democrats (53%) say that automation is to blame for
job losses, with 46 percent blaming trade (Figure 10).
Figure 10: Trade vs. Automation
2017 Chicago Council Survey
Overall, which do you think is more responsible for the decline in American manufacturing
employment? (%)
n = 2,020
Overall
56
Republicans
Independents
Democrats
Core Trump supporters
International trade,
moving jobs overseas
Overall
42
Automation, replacing
workers with machines
46
58
68
74
53
40
29
25
Even though President Trump pledged to make protecting American jobs a priority in his administration
19
—
and in trade negotiations in particular—the US public overall is deeply divided over the Trump adminis-
tration’s policies on workers. Those divisions fall neatly along partisan lines. Core Trump supporters (82%)
and Republicans (64%) are largely convinced that the current administration’s approach will do more to
protect workers, while a majority of Democrats (60%) and a plurality of Independents (41%) say they will do
more to harm US workers (Figure 11).

21
Americans and Trade
More Say Trade Deals Benefit All Partners Rather than
Just One Side
Both Donald Trump and Hillary Clinton criticized trade agreements during their 2016 campaigns, and the
president has continued to attack trade deals from the Oval Oce. Americans overall tend to view
trade agreements as being mostly beneficial to all countries involved (50%) or to the United States (7%).
But 4 in 10 believe they mostly benefit other countries (34%) or benefit neither country (6%).
Democrats are especially pro-trade in their outlook, with 62 percent saying trade agreements are
mutually beneficial. In sharp contrast, a majority of core Trump supporters (58%) say that trade deals
mostly benefit other countries, and a plurality of Republicans (47%) agree (Figure 12).
Donald Trump has particularly targeted the North American Free Trade Agreement (NAFTA) as an example
of a poorly negotiated accord, calling it “the worst trade deal ever made by any country.”
20
But Americans
overall lean slightly positive on the deal—53 percent say it is good for the economy. Democrats are
especially supportive, with 7 in 10 saying it is good for the United States.
21
However, Trump’s criticism of NAFTA has found fertile ground among his base and a majority of
Republicans. Core Trump supporters hold the most negative views of the 25-year-old trade deal, with
72 percent saying it is bad for the economy. Six in 10 Republicans agree. Independents, however,
are divided, with half saying NAFTA is good for the economy.
Figure 11: Protecting or Harming American Workers?
2017 Chicago Council Survey
Do you think the current administration's approach to international aairs will: (%)
n = 2,020
Overall
32
Republicans
Independents
Democrats
Core Trump supporters
Do more to protect
American workers
Overall
41
Do more to harm
American workers
Overall
24
Make no dierence
12
30
64
82
60
41
14
6
26
27
18
9
22
What Americans Think about America First 2017 Chicago Council Survey
Who Practices Fair Trade with the United States?
President Trump has often targeted the unfair trading practices of other countries as a reason the United
States is not performing up to its economic potential. He has singled out China as the most egregious
unfair trader among the trading partners of the United States, arguing in the first presidential debate that
China is “using our country as a piggy bank to rebuild China . . . we’ve become a third-world country.”
22
On China, the American public agrees with the president. Unique among all countries included in the
survey, China alone is identified by a majority of Americans (68%) as practicing unfair trade with the
United States. Majorities of core Trump supporters (82%), Republicans (76%), Independents (71%), and
Democrats (61%) agree.
Mexico is also a frequent target of criticism by President Trump, but American attitudes about its trade
practices are more divided. The public at large is nearly evenly split, with 47 percent saying Mexico
practices fair trade and 46 percent identifying it as an unfair trader. Here, partisan divides are stark. Core
Trump supporters (76%) and Republicans (65%) say Mexico practices unfair trade. A majority of Democrats
(60%) and half of Independents (50%) disagree.
Other trading partners, however, fare better in public estimations. Majorities believe that Canada (79%),
the European Union (66%), Japan (60%), and South Korea (52%), trade fairly with the United States.
Still, Republicans are less likely than Democrats to describe each country as a fair trader, and core Trump
supporters are the least likely of all. (See Appendix Figure 5 for full results.)
Figure 12: Trade Deals between the United States and Other Countries
2017 Chicago Council Survey
Which of the following comes closest to your view on trade deals between the United States and other
countries? Do they: (%)
n = 2,020
Overall
7
Republicans
Independents
Democrats
Core Trump supporters
Mostly benefit the
United States
Overall
34
Mostly benefit other
countries
Overall
50
Benefit both the
United States and
other countries
Overall
6
Benefit neither
9
6
6
6
22
37
47
58
62
46
40
31
5
8
4
3

23
Americans and Trade
There are some striking contrasts between Trump
Republicans and non-Trump Republicans on
trade—although neither group is as pro-trade as
Democrats. Six in 10 Trump Republicans view the
United States as being on the losing side of trade
agreements (60% say that trade agreements mostly
benefit other countries) compared with one-third
of non-Trump Republicans (34%). Half of non-Trump
Republicans believe NAFTA is good for the US
NOT ALL REPUBLICANS THINK ALIKE ON TRADE
Figure 1: NAFTA
2017 Chicago Council Survey
Overall, do you think the North American Free Trade Agreement, also known as NAFTA, is good or
bad for the US economy? (%)
n = 725
Overall
53
Non-Trump Republicans
Trump Republicans
Core Trump supporters
Good
Overall
42
Bad
23
20
49
72
76
44
economy (49%), closer to the views of the overall
US public (53%) than to Trump Republicans (20%).
(See Figure 1.) Non-Trump Republicans are also less
optimistic about the new administration’s policy
impact on American workers. While a plurality,
only 41 percent of non-Trump Republicans say the
current administration’s approach will do more to
help American workers, compared with 88 percent
of Trump Republicans (Figure 2).
Figure 2: Administration’s Eect on American Workers
2017 Chicago Council Survey
Do you think the current administration's approach to international aairs will: (%)
n = 725
Overall
41
Non-Trump Republicans
Trump Republicans
Core Trump supporters
Do more to
harm American
workers
Overall
24
Make no
dierence
6
5
24
9
7
31
Overall
32
Do more to
protect American
workers
82
88
41
SIDEBAR

24
What Americans Think about America First 2017 Chicago Council Survey
Bipartisan Optimism on Trade
The 2017 survey results find Americans underscoring their optimism for the positive eects of trade on
the US economy, for US consumers, and for job creation. Continuing recent trends, Democrats are the
most pro-trade among the public. Republicans have become more positive over the past year, perhaps
reflecting hope that a Republican administration will negotiate better terms for the United States. But this
recent uptick in GOP optimism should not overshadow the fact that Republicans are consistently less
likely to see trade and trade agreements as beneficial for all countries, and their critical views of NAFTA
reflect that. Donald Trump’s messages on trade, however, most clearly resonate with his base: it is core
Trump supporters that invariably take the most negative views on trade.

25
AMERICANS ON IMMIGRATION AND
CLIMATE CHANGE
Immigration and climate change are two major issues that have been put to the test in the first six months
of America First policies. Under the Trump administration, Immigration and Customs Enforcement
ocers have greater leeway when it comes to detaining and deporting unauthorized immigrants.
23
Environmental Protection Agency ocials have tried to eliminate or minimize references to climate
change in policy documents, and they openly scorned the science behind climate change research.
24
The
2017 Chicago Council Survey results find that while the president’s approach on these issues has appealed
to core Trump supporters and many Republicans, Americans overall are moving in the opposite direction.
Public Threat Perceptions from Immigration at Lowest Level Yet
Immigration was a central issue during the 2016 presidential campaign and remains a key pillar in Donald
Trump’s America First platform. President Trump has continued to pledge to build a wall between the
United States and Mexico, and he has made several attempts to ban travelers from six predominantly
Muslim countries from entering the United States.
The anti-immigrant overtones of America First have struck a particular chord with core Trump supporters.
Among this group, 80 percent perceive immigration as a critical threat to the United States, 19 per-
centage points higher than Republicans (61%) and 60 percentage points higher than Democrats (20%).
But those anti-immigrant overtones are not resonating with most Americans. Overall, only 37 percent
of the US public now says that immigration is a critical threat, down from 43 percent in 2016 and marking
an all-time low since this question was first asked in 1998 (Figure 13). And although Republican concern
about the threat of immigration has been steady over the past two decades—roughly 6 in 10 have
consistently said that large numbers of immigrants and refugees coming into the United States represent
a critical threat—concern among Democrats and Independents has steadily declined. In fact, both
groups reached historic lows on this question in 2017.
AMERICAN PUBLIC OPINION ON IMMIGRATION HAS BECOME MORE
POLARIZED OVER THE PAST 15 YEARS. THIS FACT SERVES AS A
STARK REMINDER THAT SHARPLY DIVIDED OPINION ON IMMIGRATION
WAS NOT CREATED BY DONALD TRUMP—HE SIMPLY EXPLOITED IT.
Americans on Immigration and Climate Change
26
What Americans Think about America First 2017 Chicago Council Survey
American public opinion on immigration has become more polarized over the past 15 years. This
fact serves as a stark reminder that sharply divided opinion on immigration was not created by Donald
Trump—he simply exploited it.
Increasing Percentages Agree on Path to Citizenship for
Illegal Immigrants
Along with these overall declining concerns about immigrants and refugees coming into the country, there
is a sizeable and growing consensus about the best way to deal with illegal immigrants currently working
in the United States. Among all Americans, two-thirds (65%) support a path to citizenship with or with-
out conditions, up from 58 percent in 2016. Conversely, fewer Americans now say that illegal immigrants
should be required to leave their jobs and the United States (22% compared with 31% in 2013).
25
But that consensus still features deep partisan divides. A clear majority of Democrats (77%) and Indepen-
dents (63%) favor a pathway to citizenship either immediately or after a waiting period and paying a
penalty. A bare majority of Republicans (52%) also favor a pathway to citizenship with or without conditions
while 36 percent of Republicans favor deportation.
Core Trump supporters are the most inclined to support deportation, but even they are divided in their
views, with equal numbers supporting deportation (45%) and a path to citizenship (45%) for illegal
immigrants (Figure 14). This places them largely in-line with Republicans overall but sets both Republicans
and core Trump supporters far apart from overall American opinion.
Republicans
Independents
Democrats
56
51
58
Figure 13: Immigration as a Threat
Below is a list of possible threats to the vital interest of the United States in the next 10 years. For each
one, please select whether you see this as a critical threat, an important but not critical threat, or not an
important threat at all: Large numbers of immigrants and refugees coming into the United States.
(% critical threat)
n = 2,020
58
63
57
62
50
49
62
44
46 47
63
44
51
41
62
55
40
30
42
21
55
46
29
27
64
36
40
20
61
67
1998 2002 2004 2006 2008 2010 2012 2014 2015 2016 2017
2017 Chicago Council Survey
Overall
55
Overall
37

27
Majority Continue to Favor US Participation in Paris Agreement
The Trump administration has also pushed back against addressing climate issues. In June 2017,
President Trump convened a press conference in the White House Rose Garden to announce the United
States would “cease all implementation of the non-binding Paris Accord and the draconian financial and
economic burdens the agreement imposes on our country” and instead “pursue a new deal.”
26
Conducted just weeks after President Trump kept his campaign promise to withdraw from the Paris
Agreement on climate change, the 2017 survey results show that 6 in 10 Americans (62%) favor US par-
ticipation in the agreement. Yet overall support has declined since 2016 when 71 percent favored partic-
ipation, largely due to a marked decrease in support from Republicans. Just 37 percent of this group
(down from 57% in 2016) and 24 percent of core Trump supporters want the United States to participate.
Majorities of Democrats (83%) and Independents (60%), meanwhile, continue to support the agreement,
although at slightly lower levels than in 2016 (87% and 68%, respectively).
Republicans and Democrats also view the threat posed by climate change very dierently. Overall,
46 percent of Americans say that climate change is now a critical threat facing the United States. While
not a majority, it marks an all-time high for the measure and is mostly driven by increased concern
Figure 14: Illegal Immigration
2017 Chicago Council Survey
When it comes to immigration, which comes closest to your view about illegal immigrants who are
currently working in the United States? (%)
n = 2,020
Overall
38
Republicans
Independents
Democrats
Core Trump supporters
They should be allowed
to stay in their jobs and to
apply for US citizenship
Overall
27
They should be allowed
to stay in their jobs and
eventually to apply for
US citizenship only if they
pay a penalty and wait
a number of years
Overall
11
They should be allowed
to stay in their jobs with
work permits but not to
apply for US citizenship
Overall
22
They should be required
to leave their jobs and
leave the United States
51
34
26
21
26
29
26
24
10
13
11
9
11
22
36
45
Americans on Immigration and Climate Change

28
What Americans Think about America First 2017 Chicago Council Survey
among Democrats. This year’s survey results reveal the largest partisan divide yet on the threat from
climate change—in fact, there is a dramatic 53 percentage point dierence between Democrats and
Republicans. Seven in 10 Democrats think that climate change is a critical threat, compared with just 16
percent of Republicans and just 12 percent of core Trump supporters (Figure 15).
Republicans
Independents
Democrats
19
40
58
Figure 15: Climate Change as a Threat
Below is a list of possible threats to the vital interest of the United States in the next 10 years. For each
one, please select whether you see this as a critical threat, an important but not critical threat, or not an
important threat at all: Climate change (% critical threat)
n = 2,020
2008 2010 2012 2014 2015 2016 2017
2017 Chicago Council Survey
16
35
50
16
15
33
44
12
17
18
51
58
57
69
35
35
38
46
Overall
39
Overall
46
America First at Odds with Public on Climate Change and
Immigration
Immigration and climate change are two areas in which the Trump administration has pursued radically
dierent paths from the Obama administration. Those decisions have elicited very dierent reactions
across party lines. While Republicans and core Trump supporters back the president’s decision to with-
draw from the Paris Agreement, Americans overall disagree—and overall concern about climate change
is on the rise. In addition, the views among Republicans are not unanimous: a slight majority of Republicans
who are not core Trump supporters back the Paris Agreement.
Similarly, although Republicans and core Trump supporters remain concerned about the possibility of
large numbers of immigrants and refugees coming into the United States, American concern overall
continues to decline. At the same time, a growing number of Americans support providing unauthorized
immigrants a path to citizenship. On both climate change and immigration, Trump’s America First
policies are giving his base and many in his party what they want. These policies, however, run counter to
the views of the overall American public.

29
On the controversial and very partisan issues of
immigration and climate change, there are notable
dierences in opinion between Trump Republi-
cans and non-Trump Republicans. While Trump
Republicans are equally likely to favor deporta-
tion and oppose a path to citizenship for illegal
immigrants in the United States, non-Trump
NOT ALL REPUBLICANS THINK ALIKE ON IMMIGRATION
AND CLIMATE CHANGE
Figure 2: Paris Agreement on Climate Change
2017 Chicago Council Survey
Based on what you know, do you think the United States should or should not participate in the
following international agreements: the Paris Agreement that calls for countries to collectively reduce
their emissions of greenhouse gases (% should participate)
n = 725
Non-Trump Republicans
Trump Republicans
Core Trump supporters
Overall
62
24
23
53
Republicans are decisively more likely to favor a
path to citizenship (Figure 1). And while only
23 percent of Trump Republicans favor US par-
ticipation in the Paris Agreement on climate
change, a slight majority (53%) of non-Trump
Republicans support it (Figure 2).
Figure 1: Illegal Immigrants Working in the United States
2017 Chicago Council Survey
When it comes to immigration, which comes closest to your view about illegal immigrants who are
currently working in the United States? (%)
n = 725
Overall
65
Non-Trump Republicans
Trump Republicans
Core Trump supporters
They should be allowed
to apply for citizenship
(with or without penalty)
Overall
22
They should be required
to leave their jobs and
leave the United States
45
43
62
45
46
25
SIDEBAR
Americans on Immigration and Climate Change

30
What Americans Think about America First 2017 Chicago Council Survey
Since President Trump moved into the White House, he and his advisers have sometimes oered
contrasting views on foreign policy. In a recent example, Secretary of Defense Jim Mattis openly diered
with the president on the best way to deal with North Korea’s nuclear program. Speaking with reporters,
Secretary Mattis emphasized a diplomacy-first approach with Pyongyang, countering President Trump’s
tweet in which he proclaimed that “talking is not the answer!”
27
Secretary of State Rex Tillerson
reportedly favored the United States remaining in the Paris Agreement, and similar dierences between
the president and Congressional leaders toward NATO allies were described previously in this report.
The 2017 Chicago Council Survey data show that American public opinion similarly diers between core
Trump supporters and others. While core Trump supporters seem to embrace the ideas behind America
First, most Americans (including non-Trump Republicans) lean toward more mainstream foreign policy
approaches. They express remarkably enduring support for an active US role in world aairs, for main-
taining and guaranteeing US security alliances, and for America’s international trade relationships. They
also favor oering undocumented immigrants an opportunity to earn citizenship and support continued
participation in the Paris Agreement. Even though a portion of Americans have some questions about
how much the United States gets out of security alliances and existing trade agreements, the American
public as a whole seems to recognize clear value in sustaining them.
CONCLUSION

31
APPENDIX
Appendix Figure 1: Global Influence
2017 Chicago Council Survey
I would like to know how much influence you think each of the following countries has in the world.
Please answer on a 0 to 10 scale, with 0 meaning they are not at all influential and 10 meaning they are
extremely influential. (mean score)
n = 2,020
Republicans
Independents
Democrats
Core Trump supporters
United States
Overall
8.3
8.0
8.7
8.9
8.3
China
Overall
6.8
6.7
6.9
6.8
6.9
Russia
Overall
6.5
6.2
6.8
7.0
6.6
European Union
Overall
6.3
6.6
6.1
5.8
6.1
United Kingdom
Overall
6.2
6.2
6.3
6.1
6.1
Germany
Overall
5.8
5.9
5.5
5.3
5.8
South Korea
Overall
4.4
4.6
4.4
4.2
4.3
India
Overall
4.2
4.4
4.0
3.8
4.1
Appendix

32
What Americans Think about America First 2017 Chicago Council Survey
Appendix Figure 2: Achieving US Foreign Policy Goals
2017 Chicago Council Survey
How eective do you think each of the following approaches is to achieving the foreign policy goals of the
United States? (% very eective)
n = 2,020
RepublicansDemocrats Independents
Core Trump
supporters Overall
Maintaining US military
superiority
79
38
44 66 47
Signing free trade
agreements with
other countries
18
27
21 15 21
Placing sanctions on
other countries
30 20
21
17 22
Maintaining existing
alliances
49
55
47 43 49
Building new alliances
with other countries
34
45
34 28 36
Economic aid to
other countries
8
27
15 9 18
Military aid to other
countries
11
18
11 9 13
Military
intervention
32
16
15 24 18
Participating
in international
organizations
12
38
26 12 27
International
agreements
23 32
42
30 20

33
Appendix
Appendix Figure 3: US Military Presence
2017 Chicago Council Survey
Do you think that the US military presence in the following regions should be increased, maintained at
its present level, or decreased? (%)
n = 2,020
Republicans
Independents
Democrats
Core Trump supporters Overall
Increased
Europe
Asia-Pacific
The Middle East
8
7
9
5
66
70
68
66
63
25
21
22
31
10
19
21
12
68
67
63
60
21
13
15
27
15
30
37
19
52
49
41
46
31
20
21
34
Maintained at its
present level
Decreased
276
65 2113
49 2920

34
What Americans Think about America First 2017 Chicago Council Survey
Appendix Figure 4: The Use of US Troops Abroad
2017 Chicago Council Survey
There has been some discussion about circumstances that might justify using US troops in other parts of
the world. Would you favor or oppose the use of US troops in the following situations? (% favor)
n = 2,020
RepublicansDemocrats Independents
Core Trump
supporters Overall
If North Korea invaded
South Korea
71
59
61 70 62
To deal with
humanitarian crises
56
76
63 60 67
To stop or prevent
a government from
using chemical or
biological weapons
against its own people
80 73
73
72 78
If Russia invades a
NATO ally like Latvia,
Lithuania, or Estonia
If China initiates
a military conflict
with Japan over
disputed islands
47
35
41 46
56
If Russia invades the
rest of Ukraine
39
39
38 41 39
40
To fight against
violent Islamic
extremist groups in
Iraq and Syria
76
58
58 76 63
52
52
51 54

35
Appendix
Appendix Figure 5: Trade with the United States
2017 Chicago Council Survey
In general, do you think that the following countries practice fair or unfair trade with the United States?
(% fair)
n = 2,020
Republicans
Independents
Democrats
Core Trump supporters Overall
Canada
83
75
73
79
60
28
20
50
75
59
50
65
34
16
14
25
58
46
42
53
65
54
48
61
Mexico European Union
China South Korea Japan
47
6679
52 6025
36
What Americans Think about America First 2017 Chicago Council Survey
This report is based on the results of a survey commissioned by the Chicago Council on Global Aairs.
The 2017 edition of the survey is the latest eort in a series of wide-ranging surveys on American attitudes
toward US foreign policy. The 2017 Chicago Council Survey was made possible by the generous support
of the John D. and Catherine T. MacArthur Foundation, the Charles Koch Institute, the Korea Foundation,
the Robert R. McCormick Foundation, and the personal support of Lester Crown and the Crown family.
The survey was conducted from June 27 to July 19, 2017, among a representative national sample of
2,020 adults. The margin of sampling error for the full sample is ±2.4, including a design eect of 1.1758.
The margin of error is higher for partisan subgroups.
Partisan identification is based on respondents’ answer to a standard partisan self-identification question:
“Generally speaking, do you usually think of yourself as a Republican, a Democrat, an Independent,
or what?”
“Core Trump supporters” are defined as those respondents who answered “very favorable” to the question:
“Do you have a very favorable, somewhat favorable, somewhat unfavorable, or very unfavorable view
of the following world leaders: US President Donald Trump?” This group, 21 percent of the overall sample,
self-identify primarily as Republicans (62%), but it also includes one-third that identify as Independents
(31%) and a handful of Democrats (5%).
“Trump Republicans,” 14 percent of the overall sample, are defined as those Republicans who answered
“very favorable” to the question: “Do you have a very favorable, somewhat favorable, somewhat unfavorable,
or very unfavorable view of the following world leaders: US President Donald Trump?” “Non-Trump
Republicans,” 13 percent of the overall sample, are defined as those Republicans who answered “some-
what favorable,” “somewhat unfavorable,” or “very unfavorable” to that same question. Among self-
identified Republicans, 51 percent are Trump Republicans and 47 percent are non-Trump Republicans.
A full listing of questions asked in the 2017 Chicago Council Survey, including details on which questions
were administered to split samples, is available online at www.thechicagocouncil.org.
The survey was conducted by GfK Custom Research, a polling, social science, and market research firm
in Palo Alto, California, using a randomly selected sample of GfK’s large-scale nationwide research
panel, KnowledgePanel® (KP). The survey was fielded to a total of 3,618 panel members yielding a total of
2,181 completed surveys (a completion rate of 60.3%). The median survey length was 22 minutes. Of the
2,181 total completed surveys, 161 cases were excluded for quality-control reasons, leaving a final sample
size of 2,020 respondents.
METHODOLOGY
37
Methodology
Respondents were excluded if they failed at least one of three key checks:
• Respondents who completed the survey in eight minutes or less.
• Respondents who refused to answer half or more of the items in the survey.
• Respondents who failed two or three of the following checks:
— Refused or skipped the question that was specifically designed to make sure respondents were
paying attention. (“In order to make sure that your browser is working correctly, please select
number 4 from the list below.”)
— Refused one or more full lists that included five items or more (of which there were 13 such lists).
— Gave exactly the same answer for (“straight-lined”) every item on one of the four longest lists in
the survey (Q5, Q7, Q8, or Q12).
The GfK Knowledge Panel (KP) was originally based exclusively on a national Random Digit Dialing
(RDD) sampling methodology. To improve the representation of the panel, GfK migrated to using an
Address Based Sampling (ABS) methodology via the Delivery Sequence File (DSF) of the USPS for
recruiting panel members in 2009. This probability-based sampling methodology improves population
coverage and provides a more eective sampling infrastructure for recruitment of hard-to-reach
individuals, such as young adults and those from various minority groups. It should be noted that under
the ABS recruitment, individuals in households without an internet connection are provided with a
web-enabled device and free internet service. Thus, the sample is not limited to those in the population
who already have internet access.
Generally, the specific survey samples represent an equal probability selection method (EPSEM) sample
from the panel for general population surveys. The raw distribution of KP mirrors that of US adults fairly
closely, barring occasional disparities that may emerge for certain subgroups due to dierential attrition.
To ensure selection of general population samples from KP behave as EPSEM, additional measures
are undertaken, starting by weighting the pool of active members to the geodemographic benchmarks
secured from the latest March supplement of the Current Population Survey (CPS) along several
dimensions. Using the resulting weights as measure of size, in the next step a probability proportional to
size (PPS) procedure is used to select study specific samples. It is the application of this PPS methodology
with the imposed size measures that produces fully self-weighing samples from KP, for which each
sample member can carry a design weight of unity. Moreover, in instances where a study design requires
any form of oversampling of certain subgroups, such departures from an EPSEM design are accounted
for by adjusting the design weights in reference to the CPS benchmarks for the population of interest.
The geodemographic benchmarks used to weight the active panel members for computation of size mea-
sures include:
• Gender (male, female)
• Age (18–29, 30–44, 45–59, 60 or older)
• Race/Hispanic ethnicity (white non-Hispanic, black non-Hispanic, other non-Hispanic, two-plus
races non-Hispanic, Hispanic)
• Education (less than high school, high school, some college, bachelor’s degree or higher)
• Census region (Northeast, Midwest, South, West)
38
What Americans Think about America First 2017 Chicago Council Survey
• Household income (less than $10,000, $10,000–$24,999, $25,000–$49,999, $50,000–$74,999,
$75,000–$99,999, $100,000–$149,999, $150,000 or more)
• Home ownership status (own, rent/other)
• Metropolitan area (yes, no)
Once the study sample has been selected and the survey administered, and all the survey data are edited
and made final, design weights are adjusted to account for any dierential nonresponse that may have
resulted during the field period. Depending on the specific target population for a given study, geodemo-
graphic distributions for the corresponding population are obtained from the CPS, the American
Community Survey (ACS), or in certain instances from the weighted KP profile data. For this purpose, an
iterative proportional fitting (raking) procedure is used to produce the final weights. In the final step,
calculated weights are examined to identify and, if necessary, trim outliers at the extreme upper and
lower tails of the weight distribution. The resulting weights are then scaled to aggregate to the total sample
size of all eligible respondents.
For this study, the following benchmark distributions of the US adult general population (age 18 or older)
from the most recent data (March 2015 Supplement) from the Current Population Survey (CPS) were used
for the raking adjustment of weights:
• Gender (male, female) by age (18–29, 30–44, 45–59, 60 or older)
• Race/Hispanic ethnicity (white non-Hispanic, black non-Hispanic, other non-Hispanic, two or more
races non-Hispanic, Hispanic)
• Census region (Northeast, Midwest, South, West) by metropolitan status (metro, nonmetro)
• Education (high school or less, some college, bachelor’s degree or higher)
• Household income (less than $25,000, $25,000–$49,999; $50,000–$74,999, $75,000–$99,999,
$100,000–$149,999, $150,000 or more)
For more information about the sample and survey methodology, please visit the GfK website at
http://www.g.com/us/Solutions/consumer-panels/Pages/GfK-KnowledgePanel.aspx.
For more information about the Chicago Council Survey, please contact Craig Kafura, research associate,
at ckafura@thechicagocouncil.org.
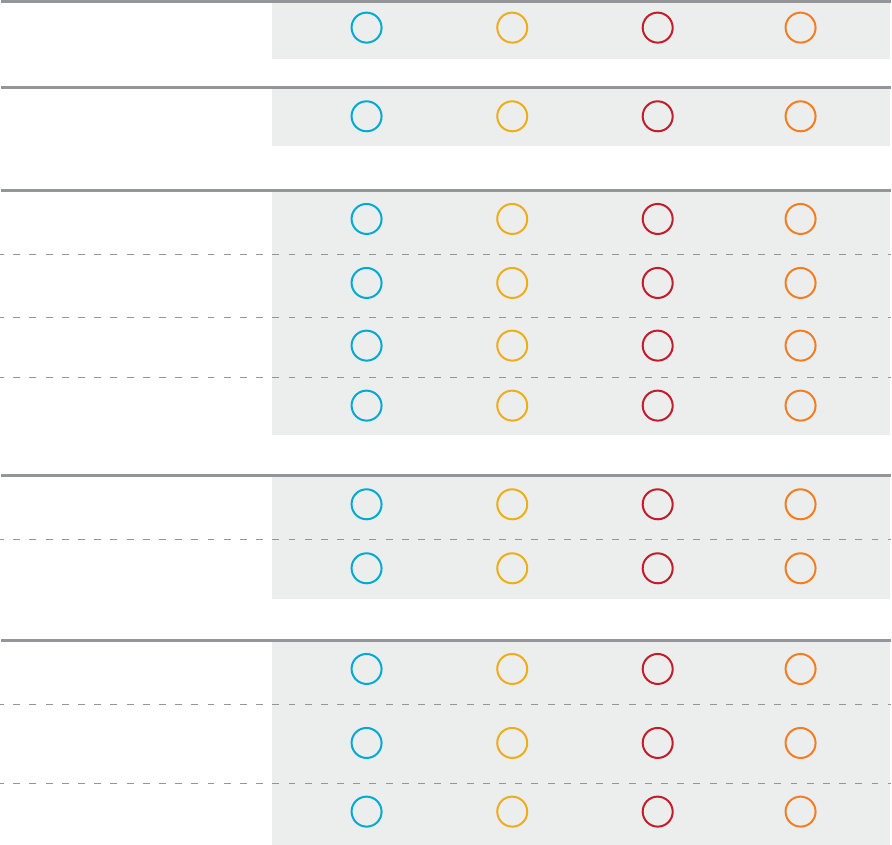
39
About the Survey Sample
ABOUT THE SURVEY SAMPLE
2017 Chicago Council Survey
% of 2017
sample
n = 2,020
Average
age
White,
non-Hispanic
Black,
non-Hispanic
Hispanic
Other,
non-Hispanic
Racial composition (%)
18–29
30–44
45–59
60+
Age (%)
High school or
less
Some college/
associate's
degree
College
graduates
Education (%)
Female
26
50
84
2
9
5
17
21
31
31
36
34
30
49
51
36
47
48
24
19
10
21
28
24
28
40
31
30
57
43
27
46
68
7
17
8
22
26
27
24
43
30
28
49
51
Male
Gender (%)
Democrat Independent Republican
21
53
84
3
8
5
13
16
33
37
45
32
22
Conservative
Moderate
Liberal
Ideology (%)
74
22
3
10
36
53
29
50
19
72
23
3
44
56
Core Trump
supporters
About the Survey Sample

40
What Americans Think about America First 2017 Chicago Council Survey
2017 Chicago Council Survey
% of 2017
sample
n = 2,020
Average
age
White,
non-Hispanic
Black,
non-Hispanic
Hispanic
Other,
non-Hispanic
Racial composition (%)
18–29
30–44
45–59
60+
Age (%)
High school or
less
Some college/
associate's
degree
College
graduates
Education (%)
Female
26
50
84
2
9
5
17
21
31
31
36
34
30
49
51
36
47
48
24
19
10
21
28
24
28
40
31
30
57
43
27
46
68
7
17
8
22
26
27
24
43
30
28
49
51
Male
Gender (%)
Democrat Independent Republican
21
53
84
3
8
5
13
16
33
37
45
32
22
Conservative
Moderate
Liberal
Ideology (%)
74
22
3
10
36
53
29
50
19
72
23
3
44
56
Core Trump
supporters
About the Survey Sample

41
ABOUT THE CHICAGO COUNCIL
SURVEY
The Chicago Council Survey, conducted every four years since 1974, biennially
since 2002, and annually since 2014, is a trusted and widely cited source
of longitudinal data on American public opinion about a broad range of US
foreign policy and international issues. With its combination of time series
and comprehensive coverage, the Chicago Council Survey is a valuable
resource to policymakers, academics, media, and the general public because
of its unique ability to capture the sense of particular eras—post-Vietnam,
post-Cold War, post-9/11—and to define critical shifts in American public
thinking. The Chicago Council Surveys are highly respected and widely used
in policy circles and academic research both in the United States and abroad.
Several scholarly works have drawn on Chicago Council survey data,
including The Foreign Policy Disconnect (Page, Bouton), Public Opinion and
American Foreign Policy (Holsti), Faces of Internationalism (Wittkopf), The
Rational Public (Page, Shapiro), and The Domestic Sources of American
Foreign Policy (ed. McCormick). All of the Chicago Council Survey data sets
are available to the public via the Roper Center and ICPSR, and the 2017
data will be available soon on www.thechicagocouncil.org.
In addition to the annual Chicago Council Survey of American public opinion
and US foreign policy, the Council’s polling has often expanded to inter-
national polling in Asia, Europe, Mexico, and Russia. Recently, the Council has
reintroduced a leaders’ survey as an important component of the 2014 and
2016 Chicago Council Surveys. Besides these comprehensive reports,
the Chicago Council Survey team publishes and disseminates short opinion
briefs on topical issues such as international trade, immigration, North
Korea’s nuclear program, and terrorism. These short reports can be found
on the Council’s website and on the Chicago Council Survey blog
www.thechicagocouncil.org/RunningNumbers.
About the Chicago Council Survey
42
What Americans Think about America First 2017 Chicago Council Survey
Executive Summary
1
For example, see Aaron Blake, “The Peril of Opposing Trump
Is Very Real,” Washington Post, September 1, 2017, www.washing-
tonpost.com/news/the-fix/wp/2017/09/01/the-peril-of-opposing-
trump-is-very-real-and-its-coming-into-focus-for-the-gop/?utm_ter-
m=.37f732991eb4.
2
The dierent ideological compositions of these Trump Republicans
and non-Trump Republicans may have some bearing on these inter-
nal Republican opinion dierences. Non-Trump Republicans (about
half of Republicans in this sample) are more likely to identify them-
selves as ideological moderates (31%) than are Trump Republicans
(16%). But both groups tend to identify more as conservatives (85%
among Trump Republicans and 64% among non-Trump Republicans).
Introduction
3
By contrast, 36 percent of Americans say that the United States
is no greater than other nations.
Americans and Alliances
4
Robin Emmott and Steve Holland, “Trump Directly Scolds NATO
Allies, Says They Owe ‘Massive’ Sums,” Reuters, May 24, 2017, http://
www.reuters.com/article/us-usa-trump-europe-idUSKBN18K34D.
5
Shayna Freisleben, “A Guide to Trump’s Past Comments about
NATO,” CBS News, April 12, 2017, https://www.cbsnews.com/news/
trump-nato-past-comments/.
6
Jerey Goldberg, “The Obama Doctrine,” The Atlantic, April
2016, https://www.theatlantic.com/magazine/archive/2016/04/the-
obama-doctrine/471525/.
7
Robert M. Gates, “The Security and Defense Agenda (Future of
NATO),” speech delivered as Secretary of Defense in Brussels,
Belgium, June 10, 2011, http://archive.defense.gov/speeches/speech.
aspx?speechid=1581.
8
Alison Mitchell, “Albright Seeks Early Vote In Senate on Larger
NATO,” New York Times, October 8, 1997, http://www.nytimes.
com/1997/10/08/world/albright-seeks-early-vote-in-senate-on-
larger-nato.html?mcubz=0.
9
Associated Press, “The Latest: Senate Jabs Trump in Unanimous
Vote on NATO,” US News, June 15, 2017, https://www.usnews.com/
news/politics/articles/2017-06-15/the-latest-senate-jabs-trump-in-
unanimous-vote-on-nato.
10
Lauren Carroll, “Donald Trump Changes NATO Position: ‘It’s No
Longer Obsolete,’” Politifact, April 12, 2017, http://www.politifact.
com/truth-o-meter/statements/2017/apr/12/donald-trump/donald-
trump-nato-i-said-it-was-obsolete-its-no-lo/.
11
“White House Again Threatens To Quit NATO If Allies’ Spending
Does Not Rise,” Radio Free Europe/Radio Liberty, May 18, 2017,
https://www.rferl.org/a/white-house-again-threatens-quit-nato-al-
lies-dont-raise-spending-as-pledged/28494735.html.
ENDNOTES
12
Dan Lamothe and Michael Birnbaum, “Defense Secretary Mattis
Issues New Ultimatum to NATO Allies on Defense Spending,”
Washington Post, February 15, 2017, https://www.washingtonpost.
com/news/checkpoint/wp/2017/02/15/mattis-trumps-defense-sec-
retary-issues-ultimatum-to-nato-allies-on-defense-spending/?utm_
term=.7a868bc4b3.
13
H.R. McMaster and Gary Cohn, “America First Doesn’t Mean
America Alone,” Wall Street Journal, May 30, 2017,
https://www.wsj.com/articles/america-first-doesnt-mean-america-
alone-1496187426.
14
The Council first asked about defending Baltic NATO allies in 2014,
and about defending South Korea from North Korea in 1990.
15
For example, see Chicago Council on Global Aairs, “Asia in the Age
of Uncertainty,” January 2017, www.thechicagocouncil.org/sites/
default/files/asia-age-of-uncertainty-report_20170201.pdf.
Americans and Trade
16
Donald Trump, “Remarks by President Trump et al. at Signing
of Trade Executive Orders,” speech, Washington, DC, March 31,
2017, https://www.whitehouse.gov/the-press-oce/2017/03/31/re-
marks-president-trump-et-al-signing-trade-executive-orders.
17
For more, see Dina Smeltz and Karen Whisler, “Pro-Trade Views on
the Rise, Partisan Divisions on NAFTA Widen,” Chicago Council on
Global Aairs, August 2017, https://www.thechicagocouncil.org/
publication/pro-trade-views-rise-partisan-divisions-nafta-widen.
18
Federica Cocco, “Most US Manufacturing Jobs Lost to Technology,
Not Trade,” Financial Times, December 2, 2016, https://www.ft.com/
content/dec677c0-b7e6-11e6-ba85-95d1533d9a62.
19
“President Trump Delivers on Jobs for the American People,” White
House Oce of the Press Secretary, March 24, 2017, https://www.
whitehouse.gov/the-press-oce/2017/03/24/president-trump-deliv-
ers-jobs-american-people.
20
Donald Trump speech in Louisville, KY, Fox Business, March 31, 2017,
https://www.youtube.com/watch?v=s5hIBNw0qj0.
21
This continues an upward trend for Democrats. In 2008, just 41 per-
cent held favorable views of the trade deal, and that number was
63 percent in 2013.
22
Hannah Beech, “Donald Trump Talked a Lot About China at the
Debate. Here’s What China Thought About That,” Time, September
26, 2016, http://time.com/4509121/china-presidential-debate-hil-
lary-clinton-donald-trump/.
43
Americans on Immigration and Climate Change
23
Marcelo Rochabrun, “ICE Ocers Told to Take Action Against
All Undocumented Immigrants Encountered While on Duty,”
ProPublica, July 7, 2017, https://www.propublica.org/article/ice-
ocers-told-to-take-action-against-all-undocumented-immigrants.
24
Lenny Bernstein, “NIH Unit Deletes References to Climate ‘Change,’”
Washington Post, August 23, 2017, https://www.washingtonpost.
com/news/to-your-health/wp/2017/08/23/nih-unit-deletes-referenc-
es-to-climate-change/; Timothy Cama, “EPA Head Casts Doubt on
Supposed Threat from Climate Change,” The Hill, August 9, 2017,
http://thehill.com/policy/energy-environment/345937-epa-head-
casts-doubt-on-supposed-threat-from-climate-change.
25
These findings are matched by other polls. For example, a Quin-
nipiac University poll conducted August 9–15, 2017, found that 63
percent of Americans say that illegal immigrants who are currently
living in the United States should be allowed to stay in the United
States and to eventually apply for US citizenship, while 22 percent
said they should be required to leave (and 10% said they should be
allowed to remain but not apply for citizenship).
26
“Statement by President Trump on the Paris Climate Accord,” Oce
of the White House Press Secretary, June 1, 2017, https://www.
whitehouse.gov/the-press-oce/2017/06/01/statement-presi-
dent-trump-paris-climate-accord.
Conclusion
27
Alexandra Wilts, “James Mattis Contradicts Trump Over North Korea
Comments: ‘We’re Never Out of Diplomatic Solutions,’” Independent,
August 30, 2017, http://www.independent.co.uk/news/world/amer-
icas/us-politics/north-korea-trump-mattis-talking-over-diplomacy-
response-a7921121.html.
Endnotes

44
What Americans Think about America First 2017 Chicago Council Survey

Additional reports based on the 2017 Chicago Council Survey are
available at www.thechicagocouncil.org:
“Two in Three Americans Support
Increased Federal Healthcare
Spending,” Craig Kafura and Dina
Smeltz, September 7, 2017.
“US Public Not Convinced that
Trump’s Policies Will Make America
Safer,” Dina Smeltz and Karl
Friedho, September 11, 2017.
“American Opinion on US-Russia
Relations: From Bad to Worse,”
Dina Smeltz and Lily Wojtowicz,
August 2, 2017.
“North Korea Now Seen as a Top
Threat Facing the United States,”
Karl Friedho and Dina Smeltz,
August 7, 2017.
“Pro-Trade Views on the Rise,
Partisan Divisions on NAFTA
Widen,” Dina Smeltz and
Karen Whisler, August 14, 2017.
Chicago Council on Global Aairs
Two Prudential Plaza
180 North Stetson Avenue
Suite 1400
Chicago, Illinois 60601
The Chicago Council on Global Aairs is an
independent, nonpartisan membership organization
that provides insight—and influences the public
discourse—on critical global issues. We convene
leading global voices, conduct independent
research, and engage the public to explore ideas
that will shape our global future. The Council is
committed to bringing clarity and oering solutions
to issues that transcend borders and transform
how people, business, and governments engage
the world.
Learn more at thechicagocouncil.org and follow
@ChicagoCouncil.
