
32 HBMA RCM AD ISOR | SEPTEMBER-OCTOBER 2017
T
his issue of RCM Advisor introduces a new series
devoted to basic Microsoft Excel functions every Excel
user should know. Back in 2013, I wrote an article about
using SUM. SUM is a great place to start, but there are many
other functions that can add power, flexibility, and accuracy
to your spreadsheets. The first function to consider is COUNT.
COUNT and COUNTA
There are two versions of counting functions in Excel, COUNT
and COUNTA. The COUNT function only counts numbers,
while COUNTA counts cells that are not empty. Consider the
example of patients and BMI measurements in Figure 1,
especially focusing on the formulas in cells B17:C18. The
formulas in row 17 use the COUNT function. The formula in
cell B17 is =COUNT(B2:B15) and the formula in cell C17 is
=COUNT(C2:C15). Since column B has patient names and
the COUNT function only counts numbers, the result in cell
B17 is zero. Column C has BMI measurements, so the
COUNT function counts 14 numbers. The formulas in row
18 use the COUNTA function, which counts all non-empty
cells, so both C17 and C18 are 14.
One way to approach the difference between COUNT and
COUNTA is to always use COUNTA to ensure that your formulas
count everything whether the data is expressed as numbers,
text, or something else. Another approach is to use COUNT
when you want to be sure to only count numbers. For example,
if your data may have N/A or other non-numeric data, COUNT
will only count numbers. Mix and match these approaches
to get the counting results you need.
AVERAGE
Averaging data is easy using the AVERAGE function, as shown
in Figure 2. Figure 2 has the same data as Figure 1 has.
The difference is that the formula in cell B17 is
=AVERAGE(B2:B15). The average BMI for this fictional group
of patients is 25.1.
Now consider the examples in Figure 3. Focus on cells E4:E6
first. Cells E4 and E6 are numbers, but cell E5 is not. The
i
Excel Functions Every
Excel User Should Know,
Pt. 1 By Nate Moore, CPA, MBA, FACMPE
FIGURE 1 FIGURE 2 FIGURE 3
33HBMA RCM AD ISOR | SEPTEMBER-OCTOBER 2017
formula in cell E8 is =AVERAGE(E4:E6). The AVERAGE function
ignores non-numeric cells, so the average is calculated based
on 10 and 8, giving a result of 9 in cell E8.
Move to cells H4:H6. In this example, cell H5 is blank. The
formula in cell H8 is =AVERAGE(H4:H6). The AVERAGE function
also ignores blank cells, so the average is again calculated
based on 10 and 8, giving a result of 9 in cell H8.
Use the AVERAGE function to give context to your numbers.
For example, a dashboard showing 24 new patients last
month may be interesting. If you show next to the 24 that
the average number of new patients in the past 12 months
is six or 40, you have given your dashboard readers a much
better way to understand the 24 new patients in context of
the past 12 months.
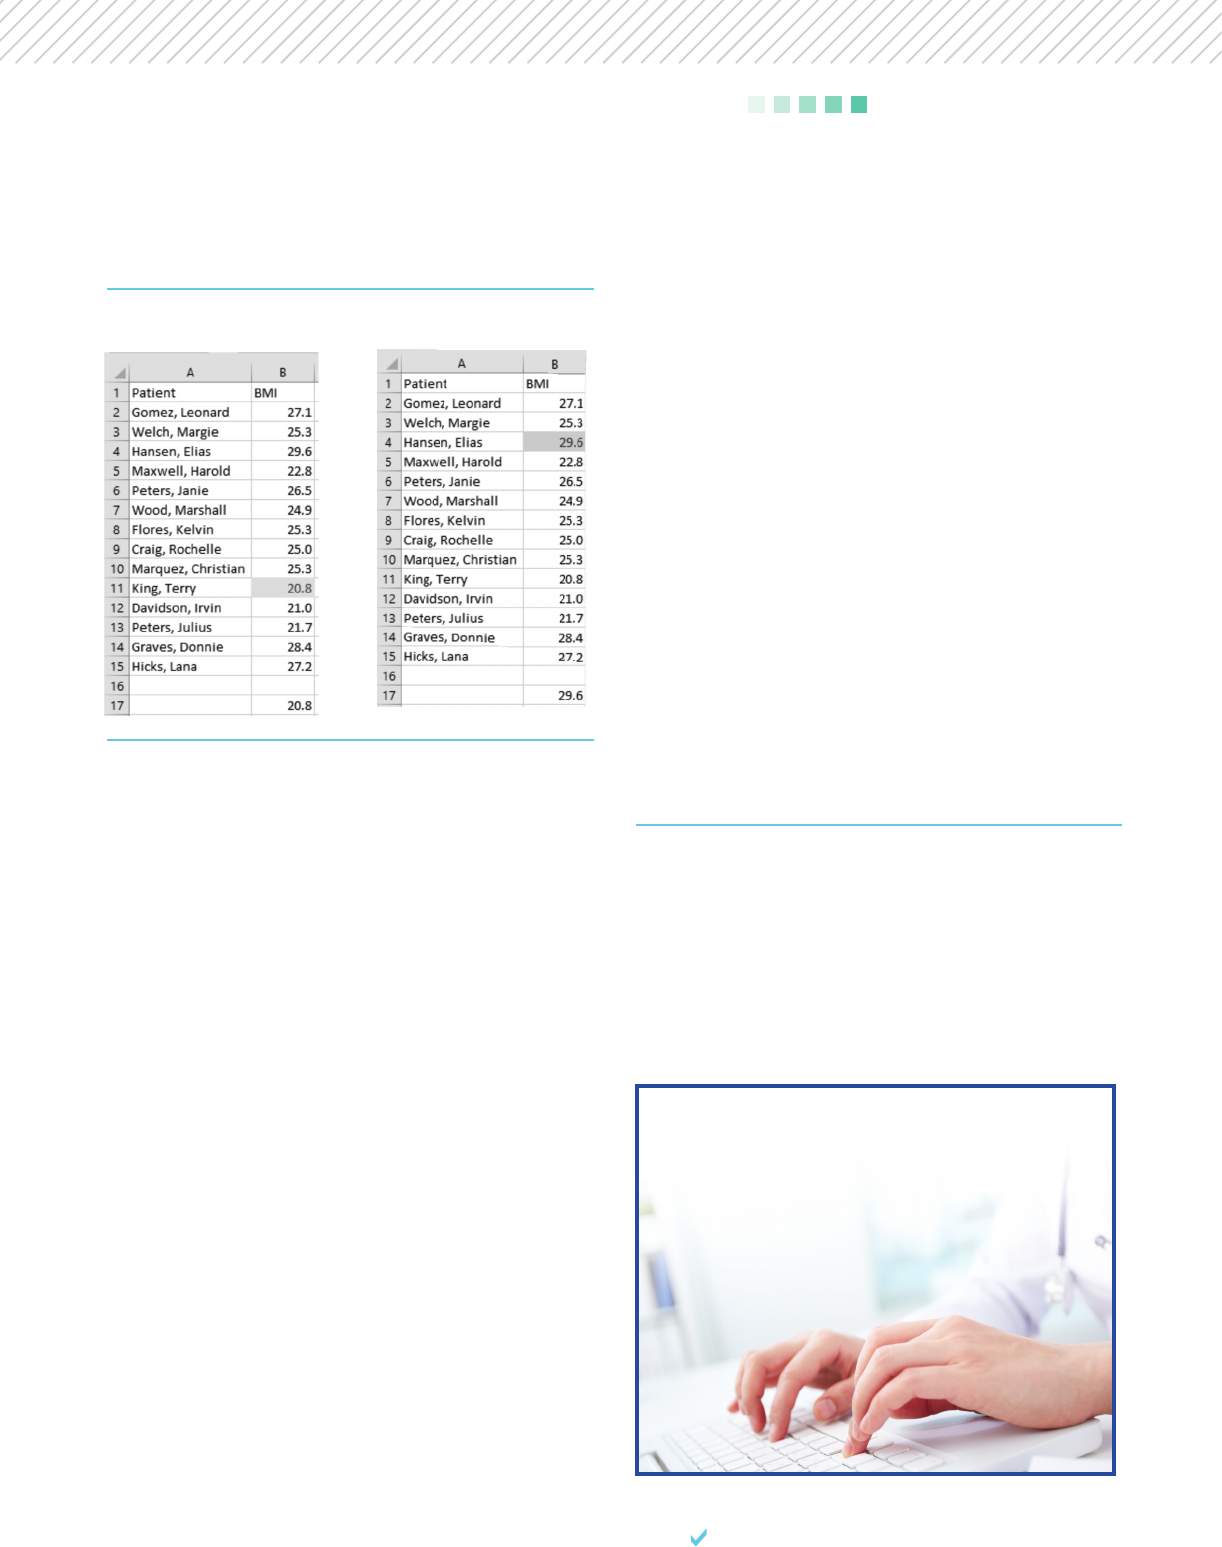
MIN and MAX
Figure 4 has the same patient BMI data, but the formula in
cell B17 is =MIN(B2:B15). The MIN formula returns the
lowest numeric value from a range. To get the maximum
value in a range of cells instead, use the MAX function.
Figure 5 has the same data as Figure 4, only with a MAX
function in the formula instead of the MIN function.
The MIN and MAX functions can also provide context to
dashboard numbers. To continue the same example from
the AVERAGE section, a dashboard could show that there
were 24 new patients last month. The dashboard could then
show that the lowest number of new patients in a month
during the past 12 months is six patients. The maximum
number of new patients in a month during the past 12
months could be 40 patients. Again, providing information
like MIN and MAX can make your dashboard much more
useful to the physicians and administrators you serve.
Figures 4 and 5 use Conditional Formatting in the MIN
and MAX examples to make it easier to identify the minimum
and maximum values. For more information about conditional
formatting, please see the series of Billing articles from
November – December 2012 through May – June 2013.
Conditional formatting is another powerful feature to make
dashboards easier to understand.
This article just scratches the surface of helpful Excel
functions. Watch for more functions in the next issue of RCM
Advisor. For dozens of free articles and hundreds of free
videos on using Excel in a medical practice, please visit
www.mooresolutionsinc.com
n
Nate Moore, CPA, MBA, FACMPE writes custom SQL Server
code to mine practice management data for analysis in
Excel, web pages, and via email. Nate’s first book, Better
Data, Better Decisions: Using Business Intelligence in the
Medical Practice, written with Mona Reimers, is an MGMA
bestseller. His free Excel Videos have been viewed over
2 million times and are available at mooresolutionsinc.com.
Like PivotTableGuy on Facebook or follow PivotTableGuy on
Twitter to be notified each time an Excel Video is released.
i
SOFTWARE TALK
FIGURE 4 FIGURE 5
Is your company doing something innovative
you’d like to share with fellow HBMA
members? Email Lisa Tomcko at
ltomcko@hbma.org for more information.
Contribute to
RCM Advisor!
